

Summary: Numerous financial metrics measure the success of a business. One of them is operating profitability ratios that track and measure the business’s overall financial health. Another benefit is that decision-makers can spot improvement areas, brainstorm strategies to increase profits, and develop ways to streamline their operations and processes. This article will shed light on profitability ratios — definition, formulas, and interpretations and how they can help improve your business profitability.

What are Profitability Ratios?
Operating profitability ratios enable companies to measure their ability to generate profit in the short and long term. Of course, companies can also gauge these abilities through the balance sheets, income statements, sales processes, or shareholder’s equity over a particular period. But operating profitability ratios help businesses understand to what extent they utilize their assets to build wealth for their shareholders.
Another benefit is that operating profitability ratios help a company evaluate previous gross profit margin, net profit margin, return on equity, and other essential financial metrics against previous periods or between similar companies. Also, investors and shareholders critically analyze the operating profitability ratios before making heavy investments.
Types of Operating Profitability Ratios
- Operating Profit Margin
- Return on Assets (ROA)
- Gross Profit Margin
- Net Profit Margin
- Return on Equity
- Return on Capital Employed
1. Operating Profit Margin
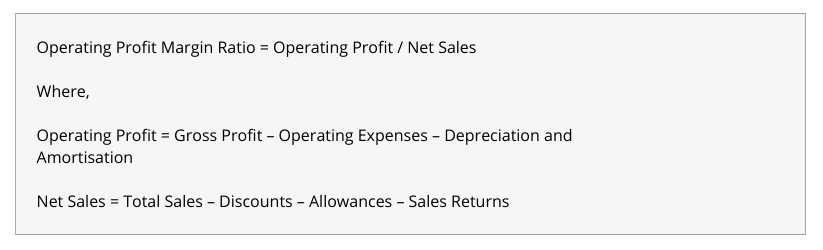
The operating profit margin allows a company to calculate its ability to maintain operational expenses before tax deductions and interest expenses. While calculating this metric, the revenue left over after costs is subtracted from net sales. If the operating profit margin is high, the company can pay its interest obligations, fixed costs, and offer its products at competitive prices. The senior management in a company uses this metric to improve profitability and efficiently handle its costs.
2. Return on Assets (ROA)
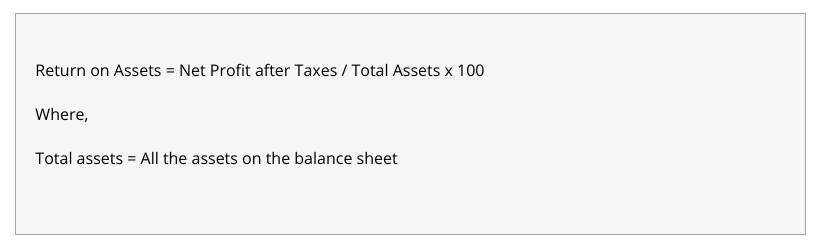
Return on Assets allows a company to measure its ability to generate profits using its assets. In short, it shows how much profit a company generates on each rupee it invests. It also describes how asset-intensive a company is. If the ROA is high, the company is generating more profits against its total number of assets. Conversely, a low ROA indicates that the company is making diminished profits against the number of assets it owns. Companies with high ROA must spend substantial money on heavy equipment and machines to increase profits. Automobile manufacturers, telecommunication companies, and railways are some examples of industries that have high ROA.
3. Gross Profit Margin
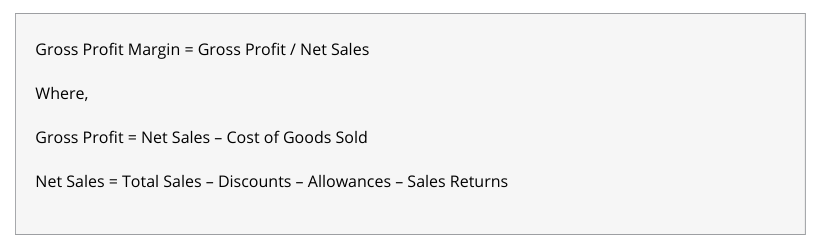
The gross profit margin metric allows organizations to calculate their profits after removing the cost price of products. A company having higher gross profit means it can cover fixed costs, expenses, and depreciation easily and generate better net returns over a sustained period. On the other hand, a low gross profit margin indicates high cost price, high selling price, and low sales.
4. Net Profit Margin
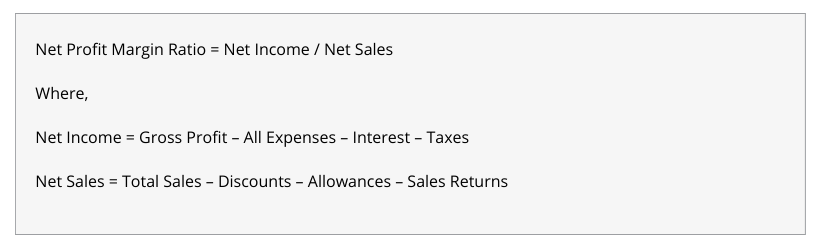
The net profit margin indicates a company’s profitability from all products sold and services consumed after subtracting direct & indirect expenses. A high net profit margin means the organization efficiently manages its input costs and final prices of products and services. But one major disadvantage of this ratio is that it only considers one-time profits and expenses. This way, it becomes challenging for companies to monitor their performance against competitors.
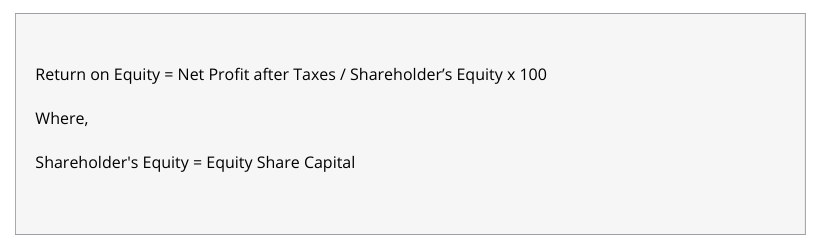
5. Return on Equity (ROE)
ROE indicates a company’s ability to turn the shareholder’s investments into massive profits. Analysts and investors critically examine ROE to estimate the return on the sum of money they have invested in the company. Moreover, people are more likely to purchase a company’s stock with a high ROE ratio. Further, organizations with a high ROE ratio can stay away from debt financing because of their ability to generate cash internally.
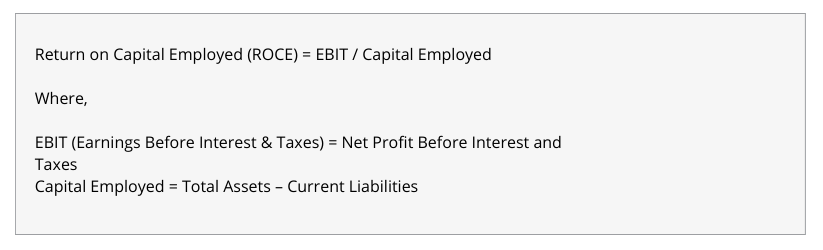
6. Return on Capital Employed (ROCE)
Return on capital employed determines the return a company makes against the total investments made by the bondholders and shareholders. This ratio provides a better picture than ROE as it also comprises capital investments made by bondholders.
Steps to calculate operating profitability ratios?
The operating profitability ratios determine whether a company has sustained profits over a particular period.
The following example will clarify the concept.
XYZ pharmaceutical Pvt. Ltd is a prominent truck tyre manufacturer. It has a total equity capital of Rs. 20 crores. While preparing tax statements at the end of the year, the total assets are worth Rs. 1 crore and the current liabilities is Rs. 20 lacs.
The table below shows how you can calculate profitability ratios:
| Ratio | Formula | Calculation | Output |
| Gross profit margin | Gross Profit Margin = Gross Profit / Net Sales | 10,00,000/15,00,000 | 66.67% |
| Operating Profit Margin | Operating Profit Margin Ratio = Operating Profit / Net Sales
Where, Operating Profit = Gross Profit – Operating Expenses – Depreciation and Amortisation Net Sales = Total Sales – Discounts – Allowances – Sales Returns |
Operating Profit = 10,00,000 – 2,00,000 – 50,000 = 7,50,000
OPM = 7,50,000/15,00,000 |
50% |
| Net Proft Margin | Net Profit Margin = | = 1,0,00,000/15,00,000 | 66.67% |
| Return on Equity | ROE = Net Profit after Taxes / Shareholder’s Equity | = 1,0,00,000/2,00,00,000 | 0.5% |
| Return on Assets | ROA = Net Profit after Taxes / Total Assets | = 10,00,000/60,00,000 | 16.67% |
| Return on Capital Employed | ROCE = EBIT / Capital Employed | EBIT = 10,00,000 – 1,00,000 – 70,000 = 8,30,000 ROCE = 8,30,000/(60,00,000 – 20,00,000) |
20.74% |
The different operating profitability ratios allow investors to pick the best companies for investing.
Benefits of calculating operating profitability ratios
Each investor wants to invest their money in companies that guarantee higher returns. The operating profitability ratio allows investors to evaluate a company’s financial health by checking these ratios.
1. High or low net margin
A high net margin means the company efficiently manages its operating and non-operating expenses reasonably. But a company can have a low net margin if it’s paying interest expenses accumulated on debt. Remember, having some debt obligations on the balance sheet isn’t too bad if a company has a positive cash flow for paying interest payments.
2. Identifying financial challenges within the company
Companies can spot several challenges in the company by critically examining financial statements, such as income statements and balance sheets. However, a careful study of operating profitability ratios is also helpful in identifying business problems, including an increase in goods price.
3. Sharing a comprehensive picture with investors
Investors carry out a detailed study of a company before investing. Operating profitability ratios provide investors with data points, enabling them to make financially sound decisions. Companies that don’t offer clean data fail to attract investors.
4. High or low Gross Margin
A high-gross margin indicates the company is charging premium prices in the market for its products or is keeping its direct costs under control. Conversely, a low-gross margin tells that direct costs are high or the company is charging less for its products.
5. Forecasting Seasonal Business
Operating profitability ratios are a boon for companies whose revenue changes drastically from one season to another. They can brainstorm effective budgeting strategies and execute strategic planning decisions by comparing the company’s historical performance across several periods.