Business Intelligence Reporting is an Excel-based reporting tool that gathers data from every module in your Sage 300 system which allows users to slice, dissect, and analyze the figures in a comfortable spreadsheet environment.
In this blog, we will show you how to configure the SQL query using a business intelligence report in Sage 300 to generate an Excel-based report.
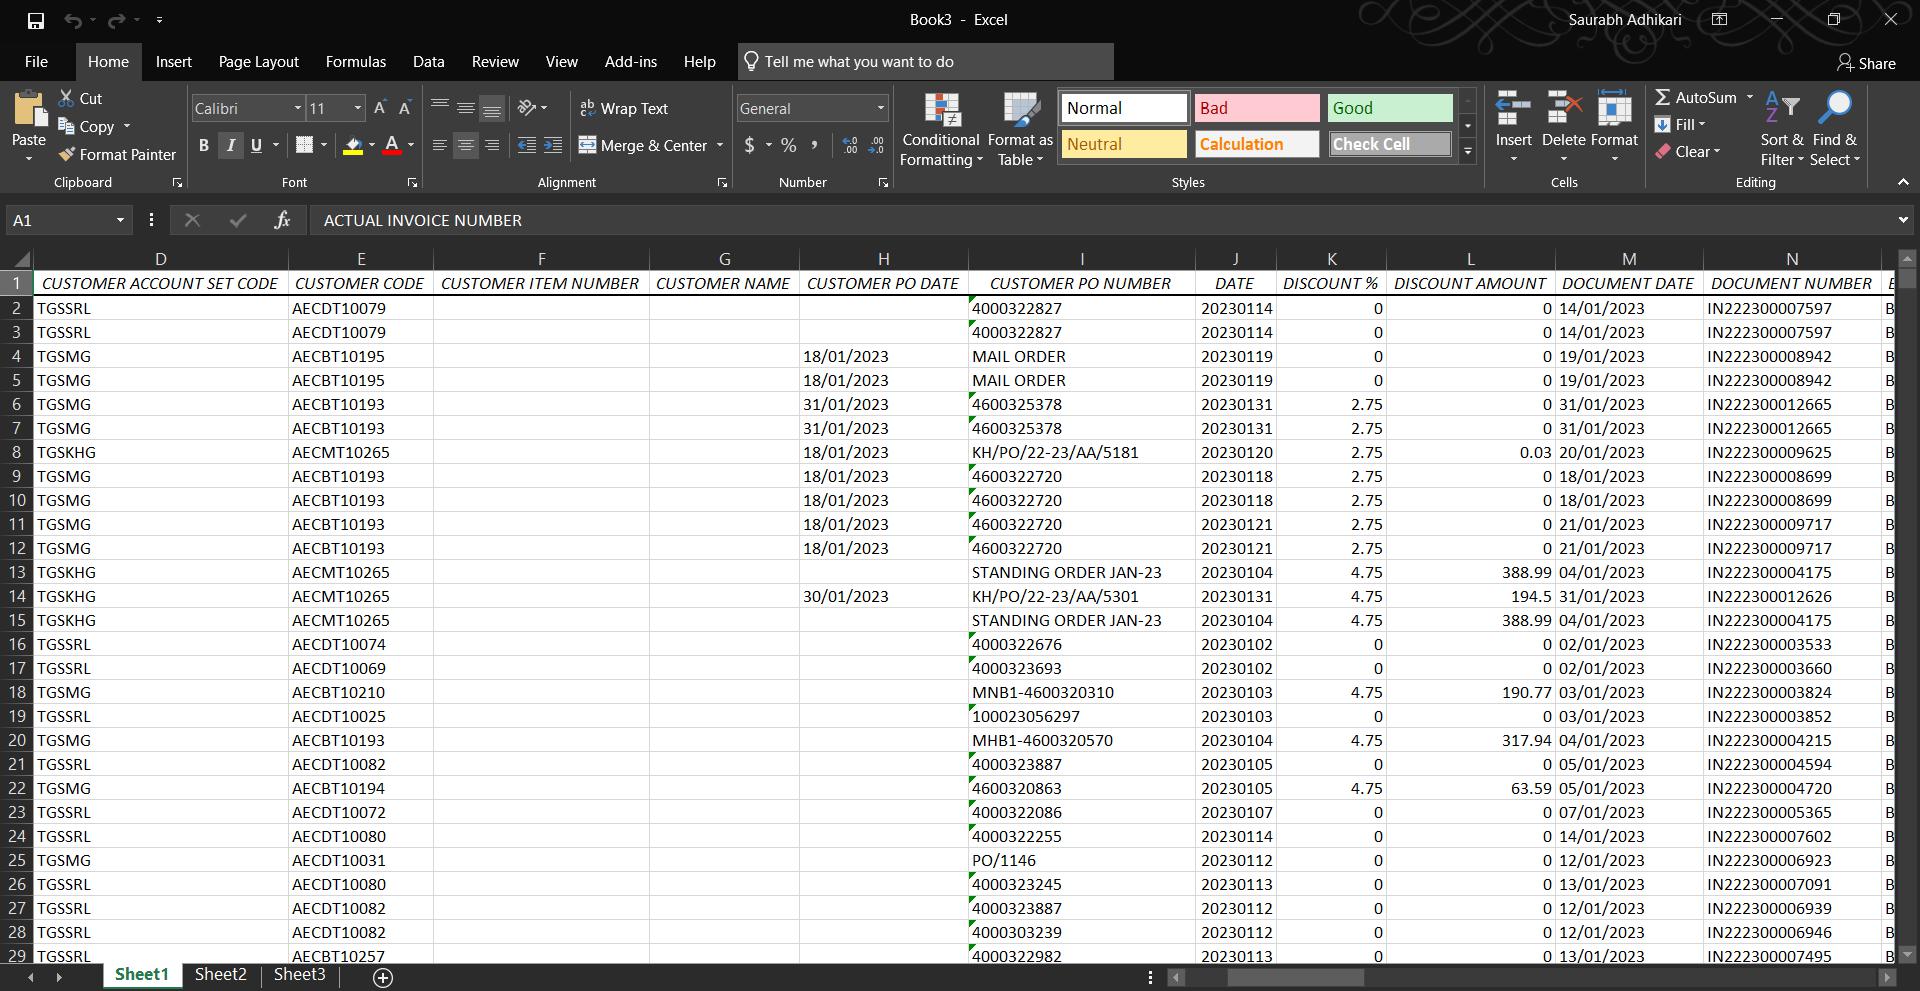
Here we will take the example of a Customised ‘Sales report’ SQL query.
⇒ Below is the Sample of BI Report of SQL query for your reference :

First, we have to execute the SQL query in the database so we can incorporate this SQL query with the Business intelligence report using the BI connector.
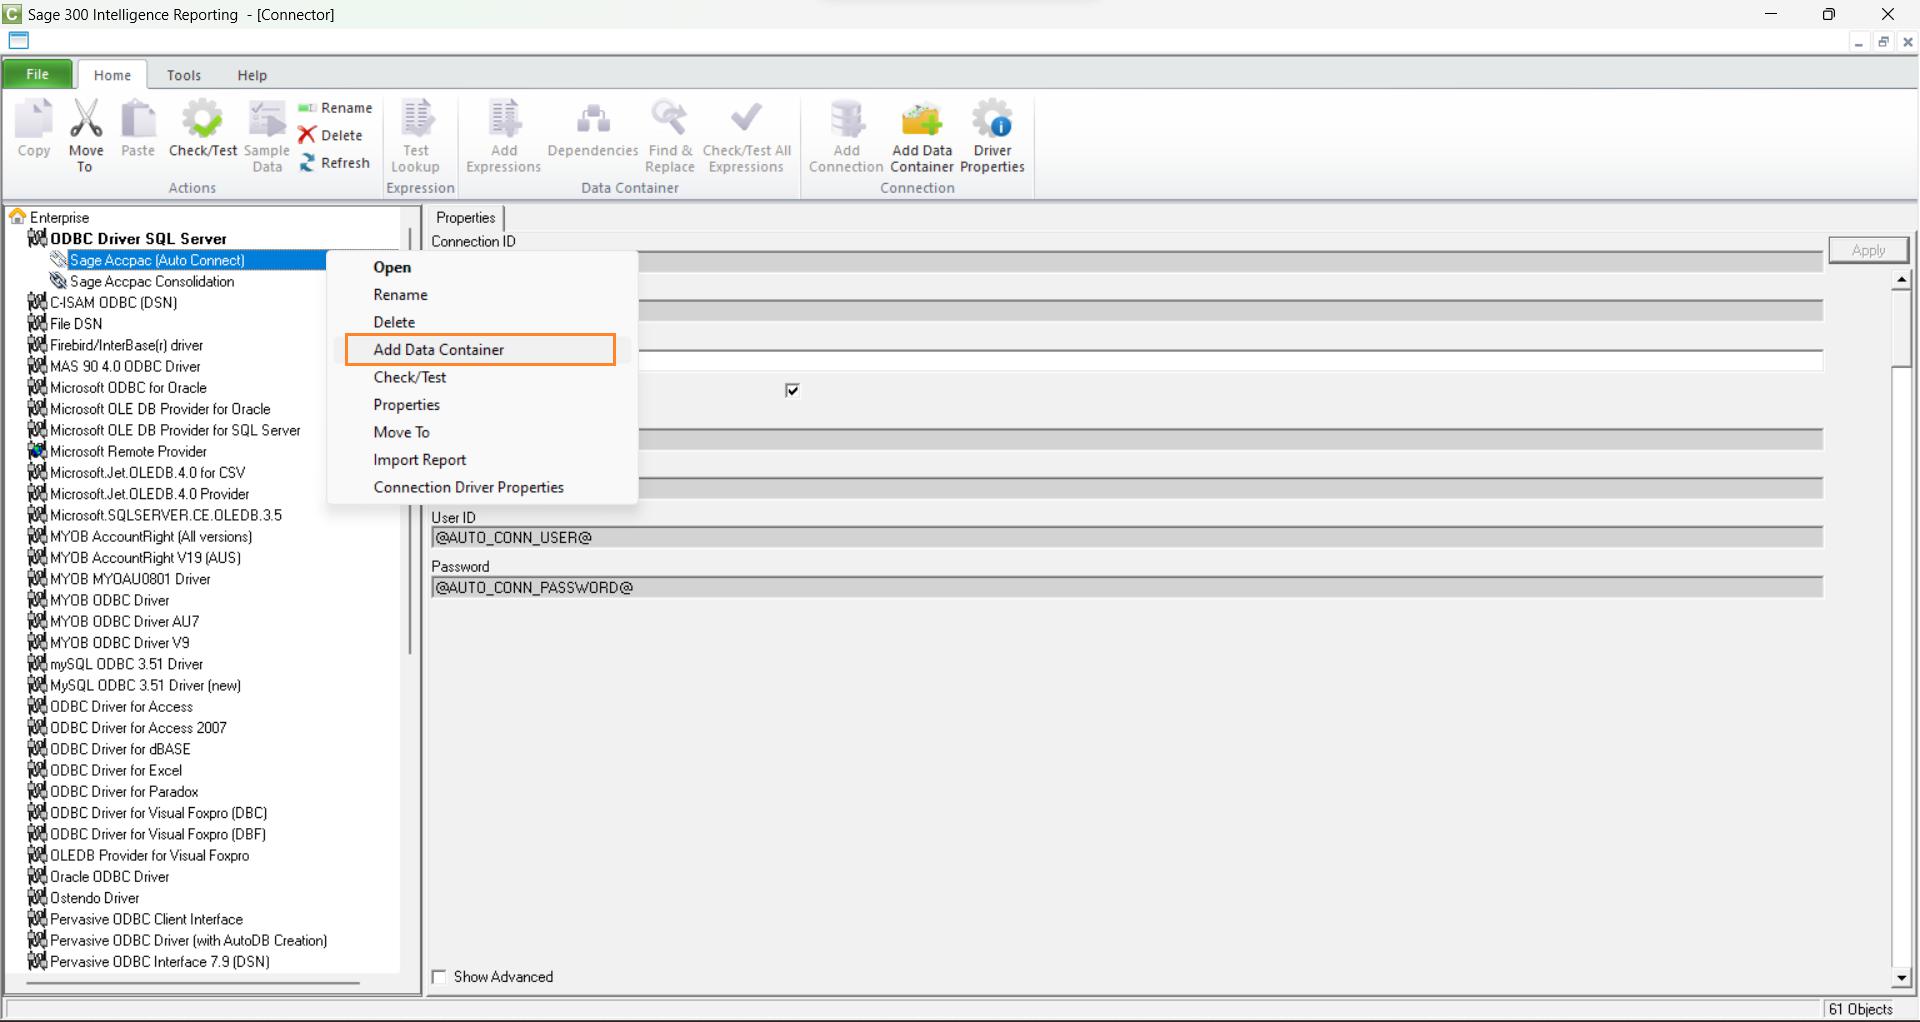
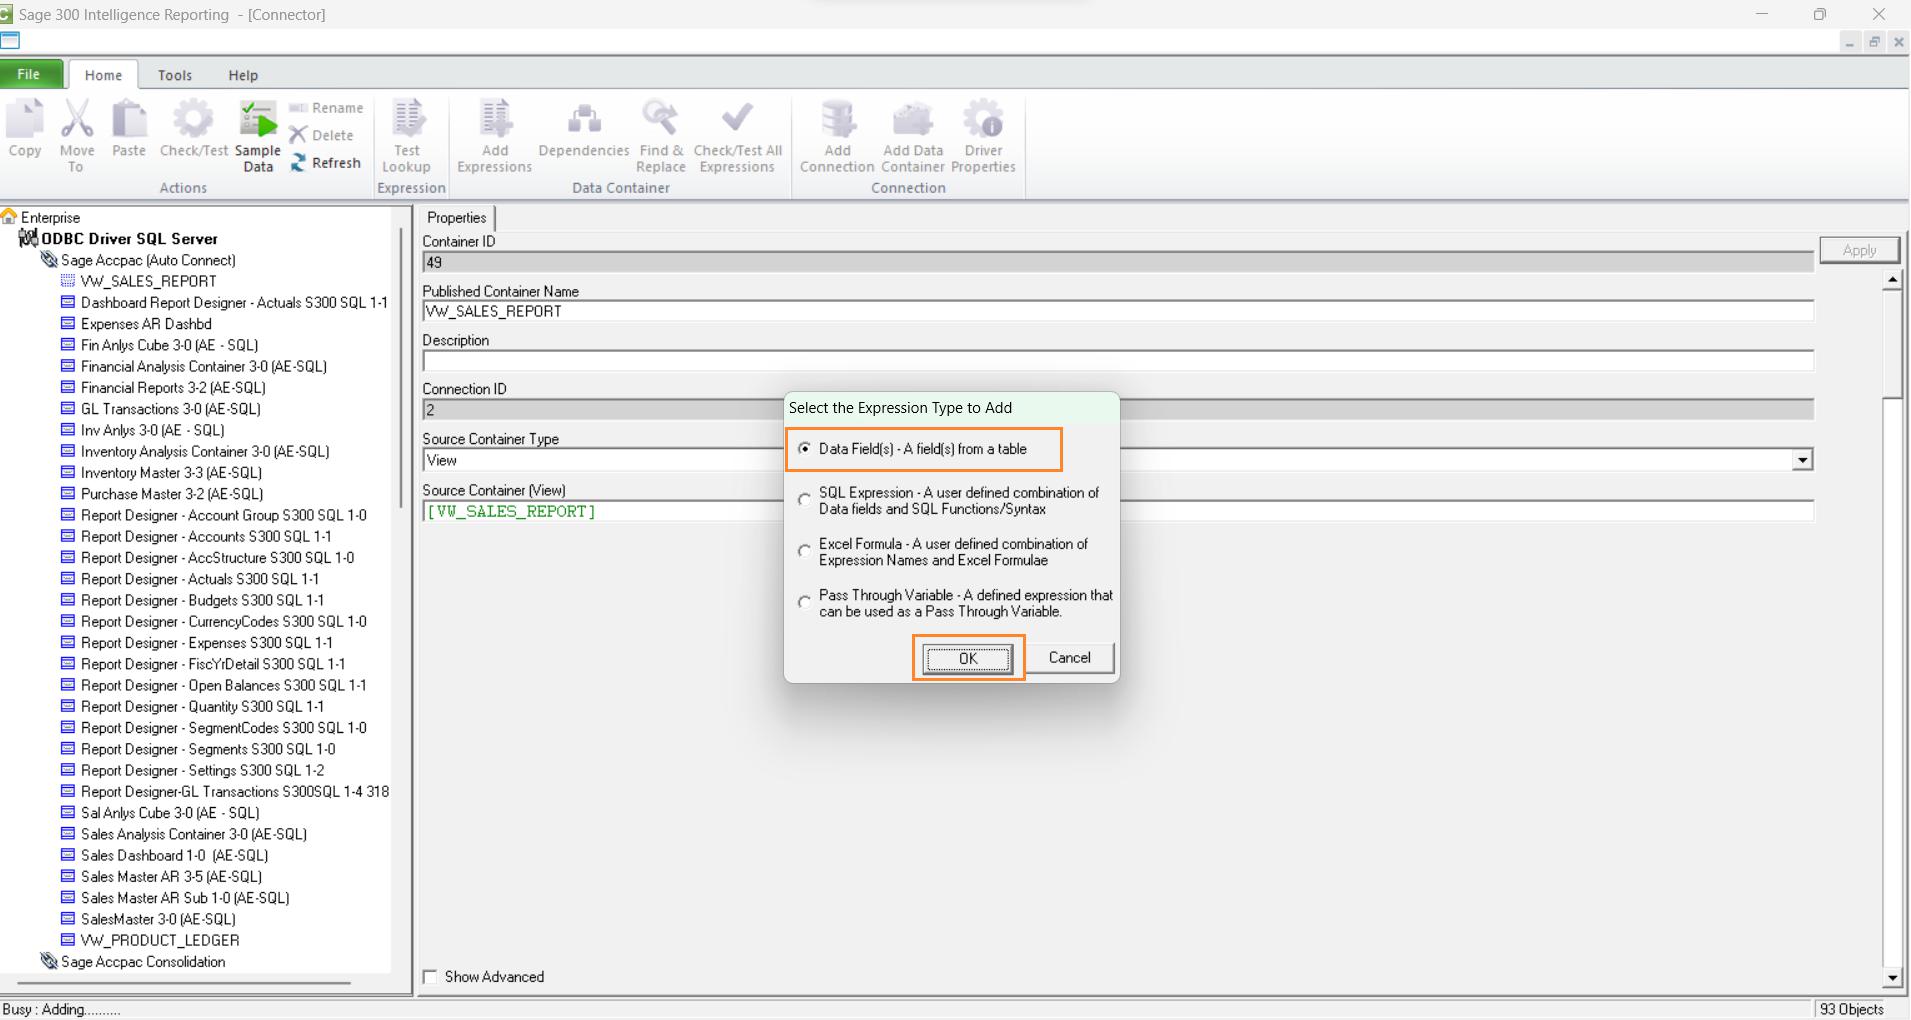
Open the BI connector in Sage 300 and click on the Enterprise to expand the menu and then click on the ODBC driver SQL server and then right-click on the Sage Accpac (Auto Connect) to add the data container i.e. the SQL query of the report which we will configure in BI connector.
⇒ Below is the image for your reference :
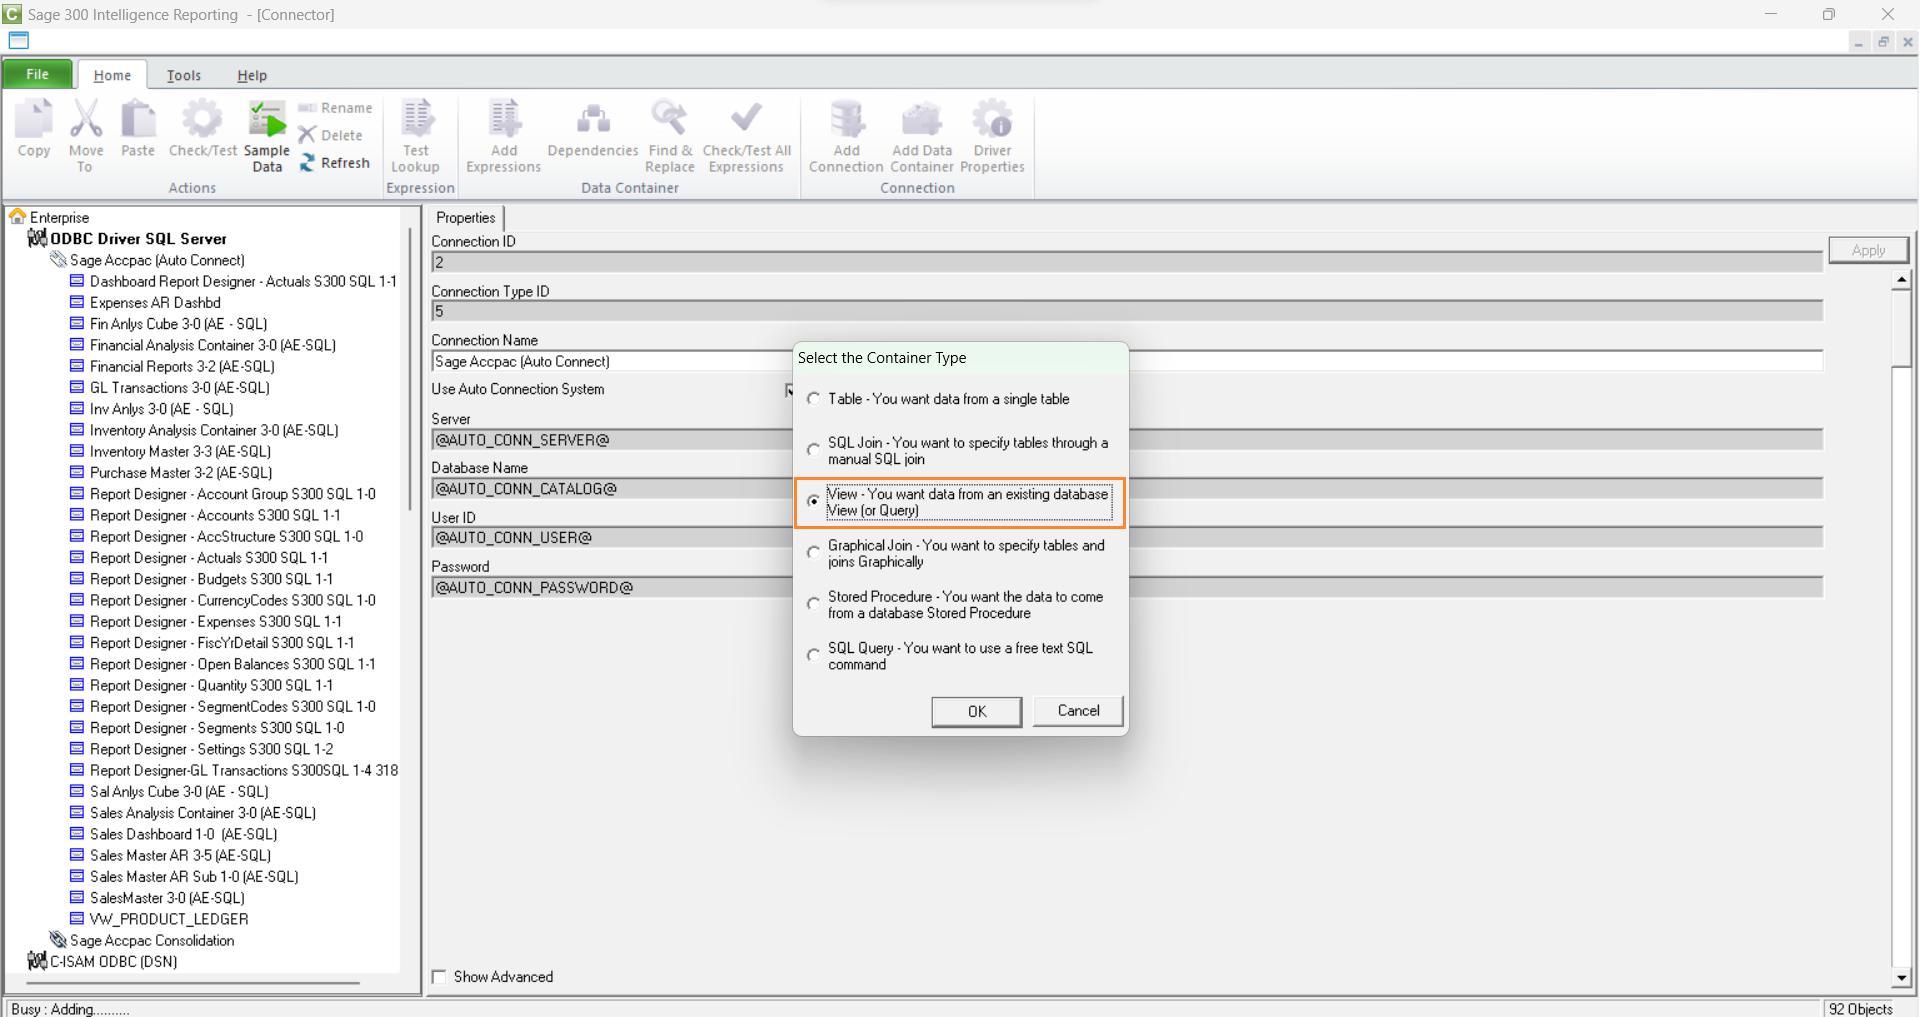
Now select the third option and click on OK
⇒ Below is the image for your reference :
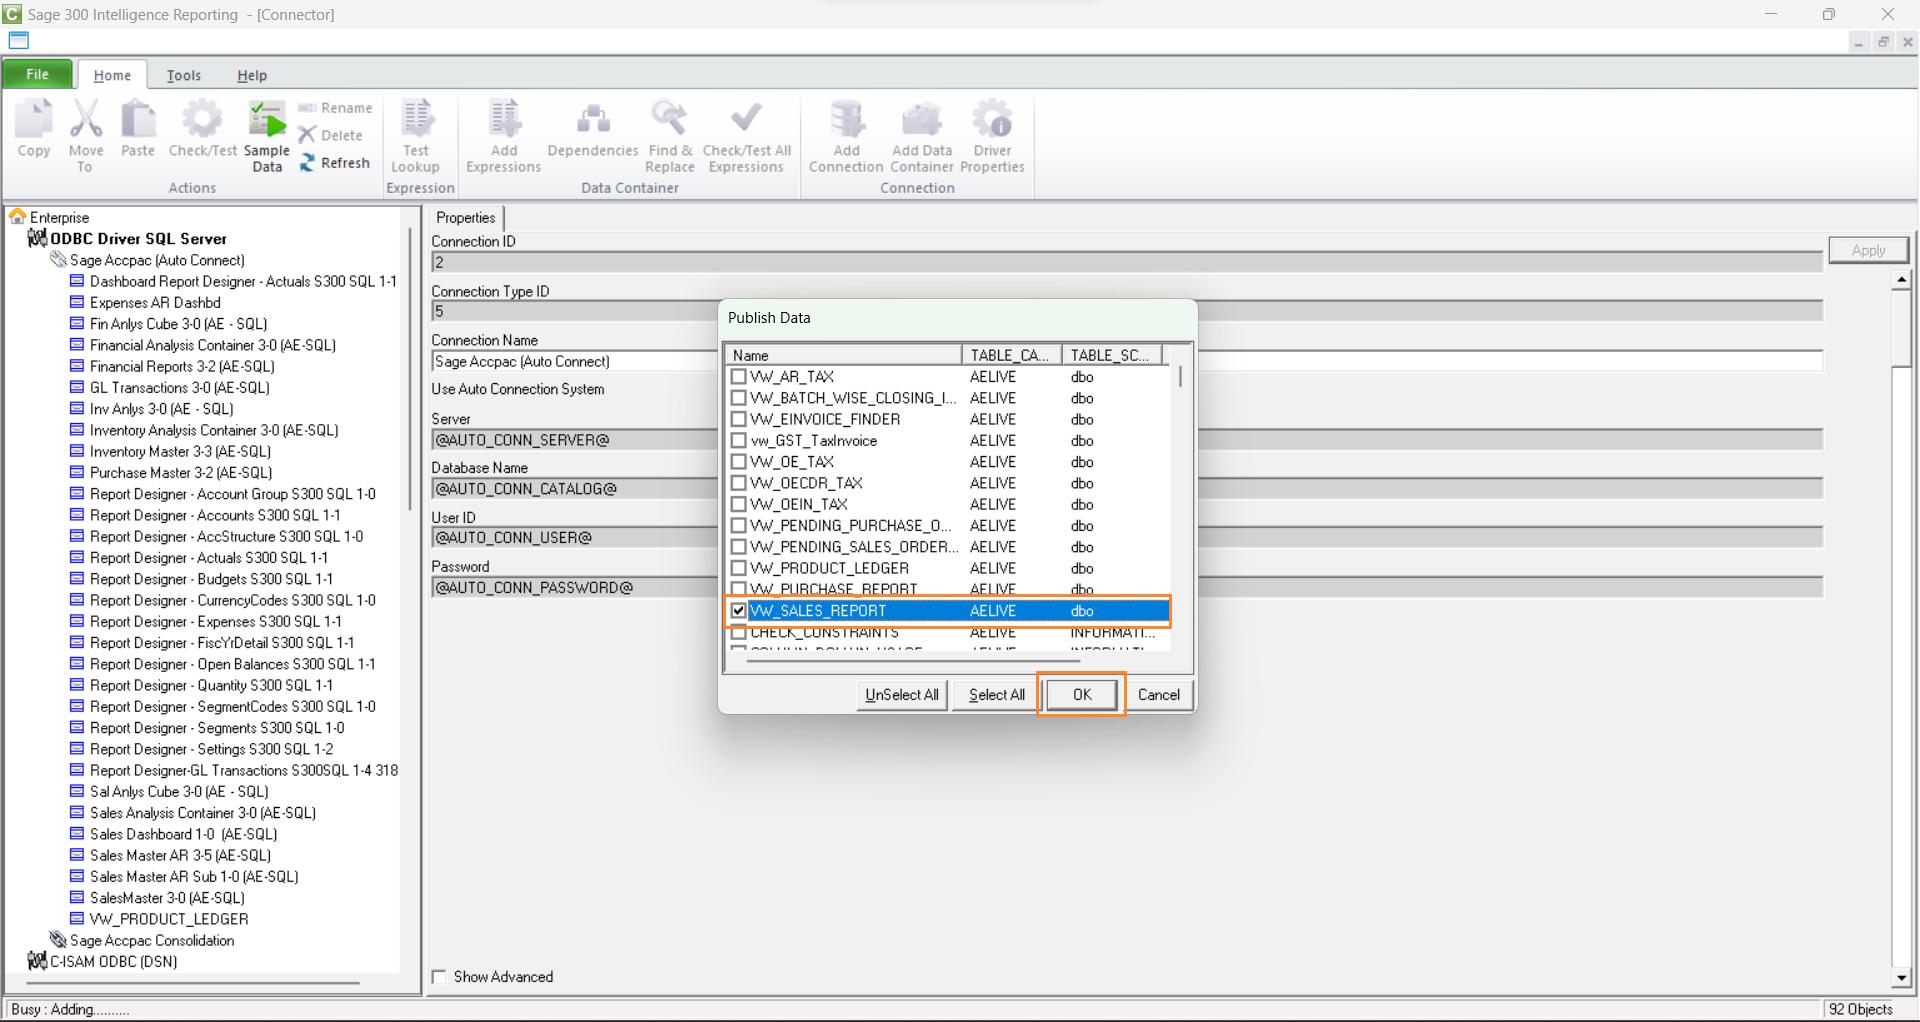
After that, locate the SQL query name which was created, in our case the name is ‘VW_sales_report’, and then click on OK to add it in the Sage Accpac (Auto Connect).
⇒ Below is the image for your reference :
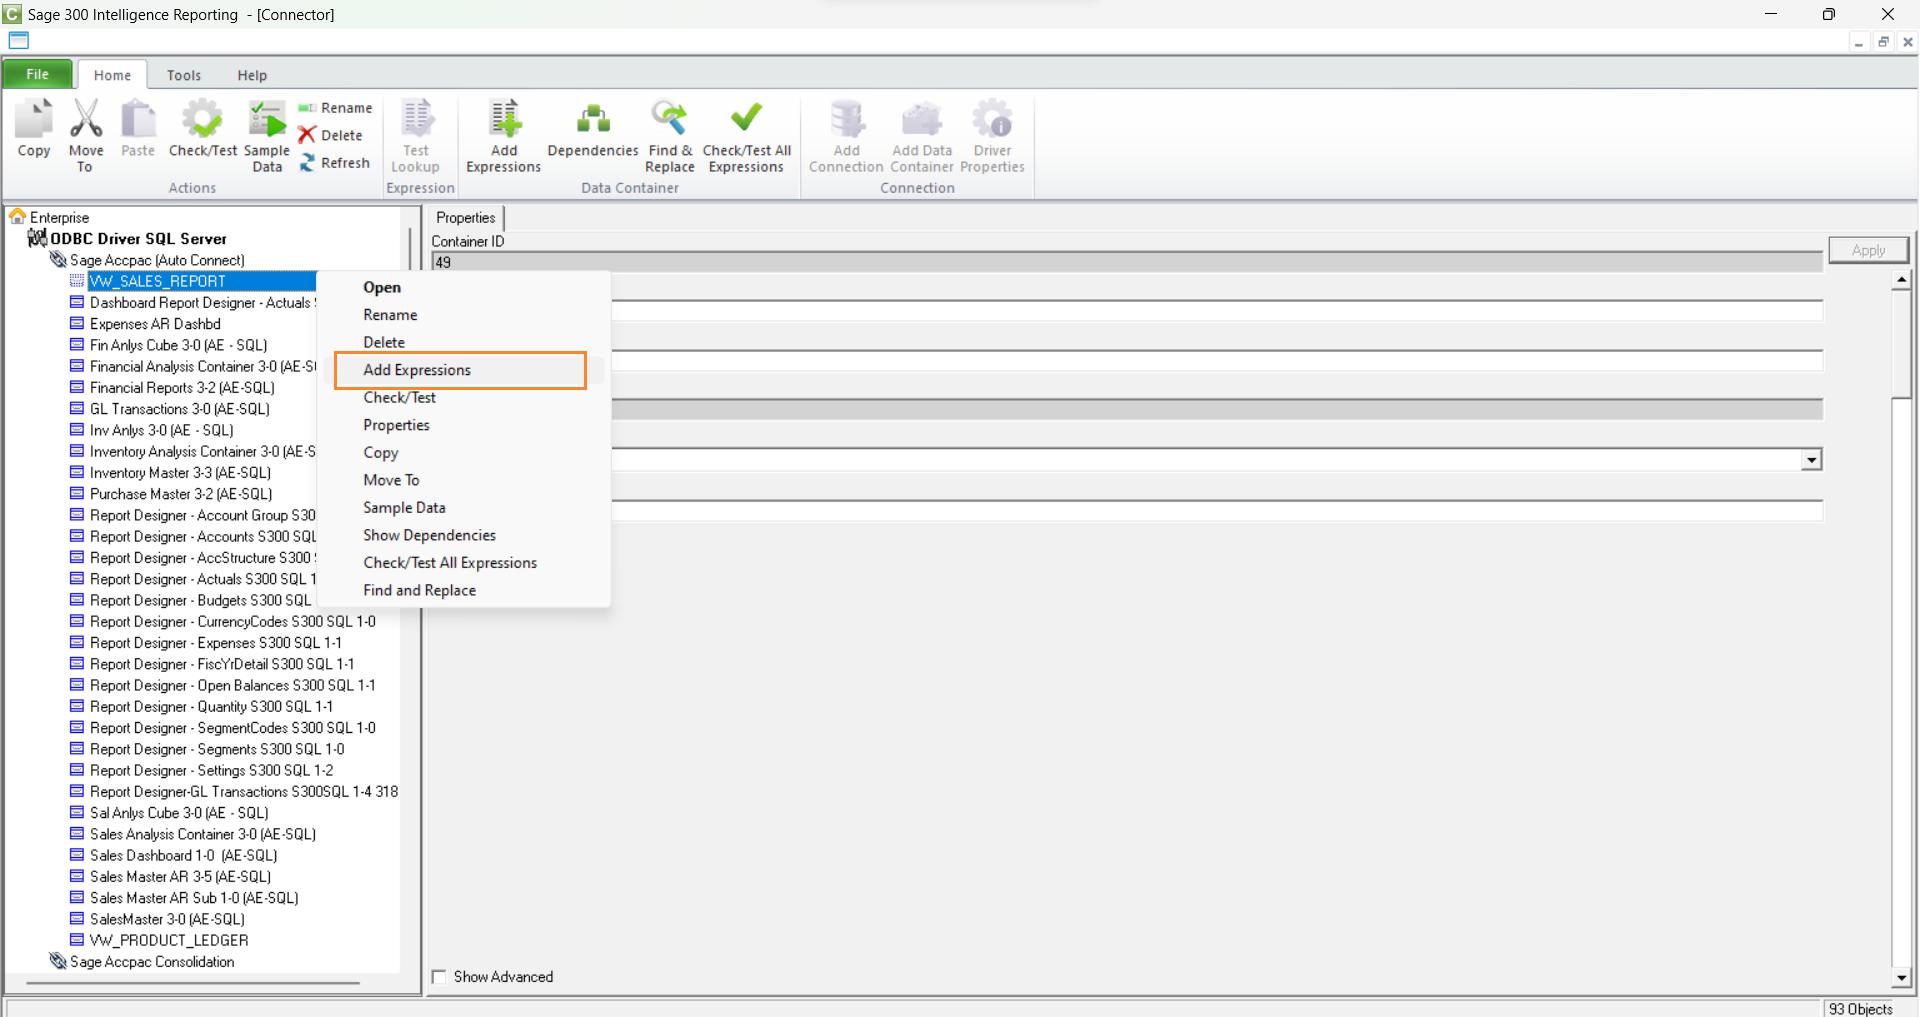
Now, expand the Sage Accpac (Auto Connect) by double click on it and then right-clicking on it to add the expression.
⇒ Below is the image for your reference :
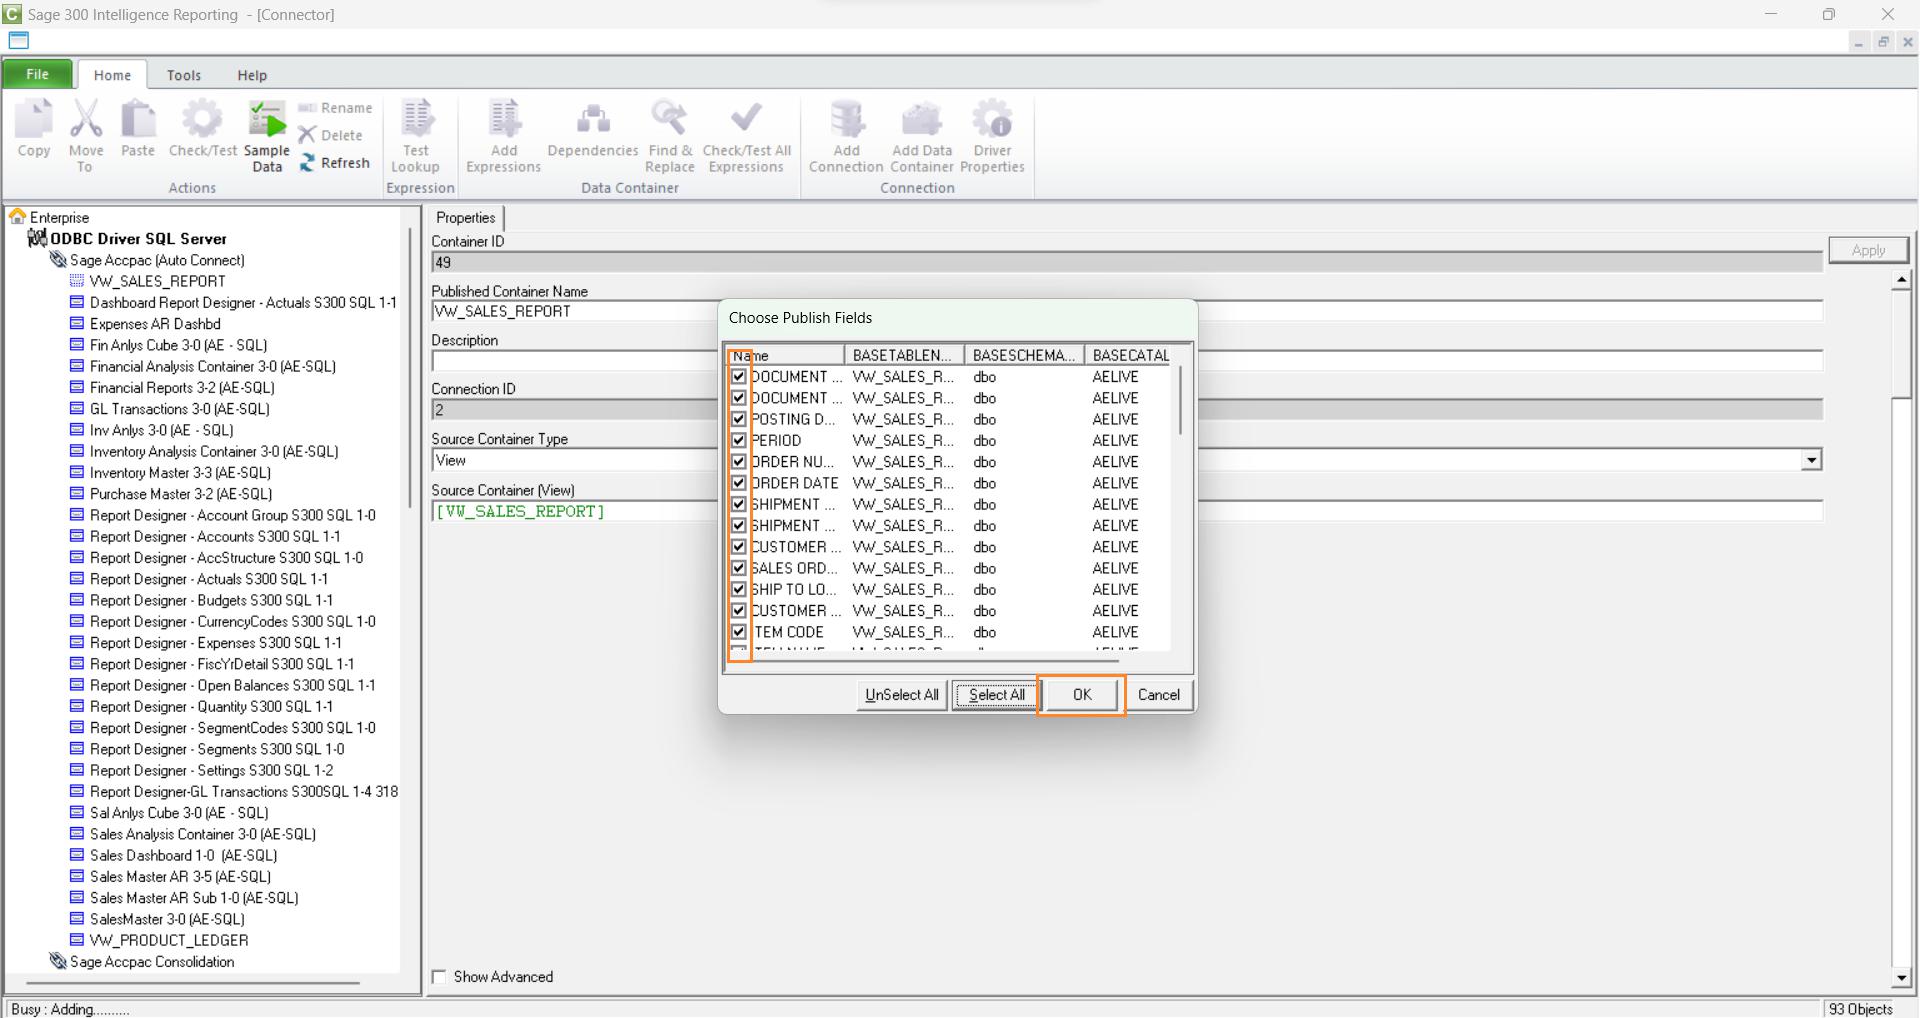
Click on the first option and then click the OK button to add all the columns present in the SQL query.
⇒ Below is the image for your reference :
Select all the columns and click on the OK button.
⇒ Below is the image for your reference :
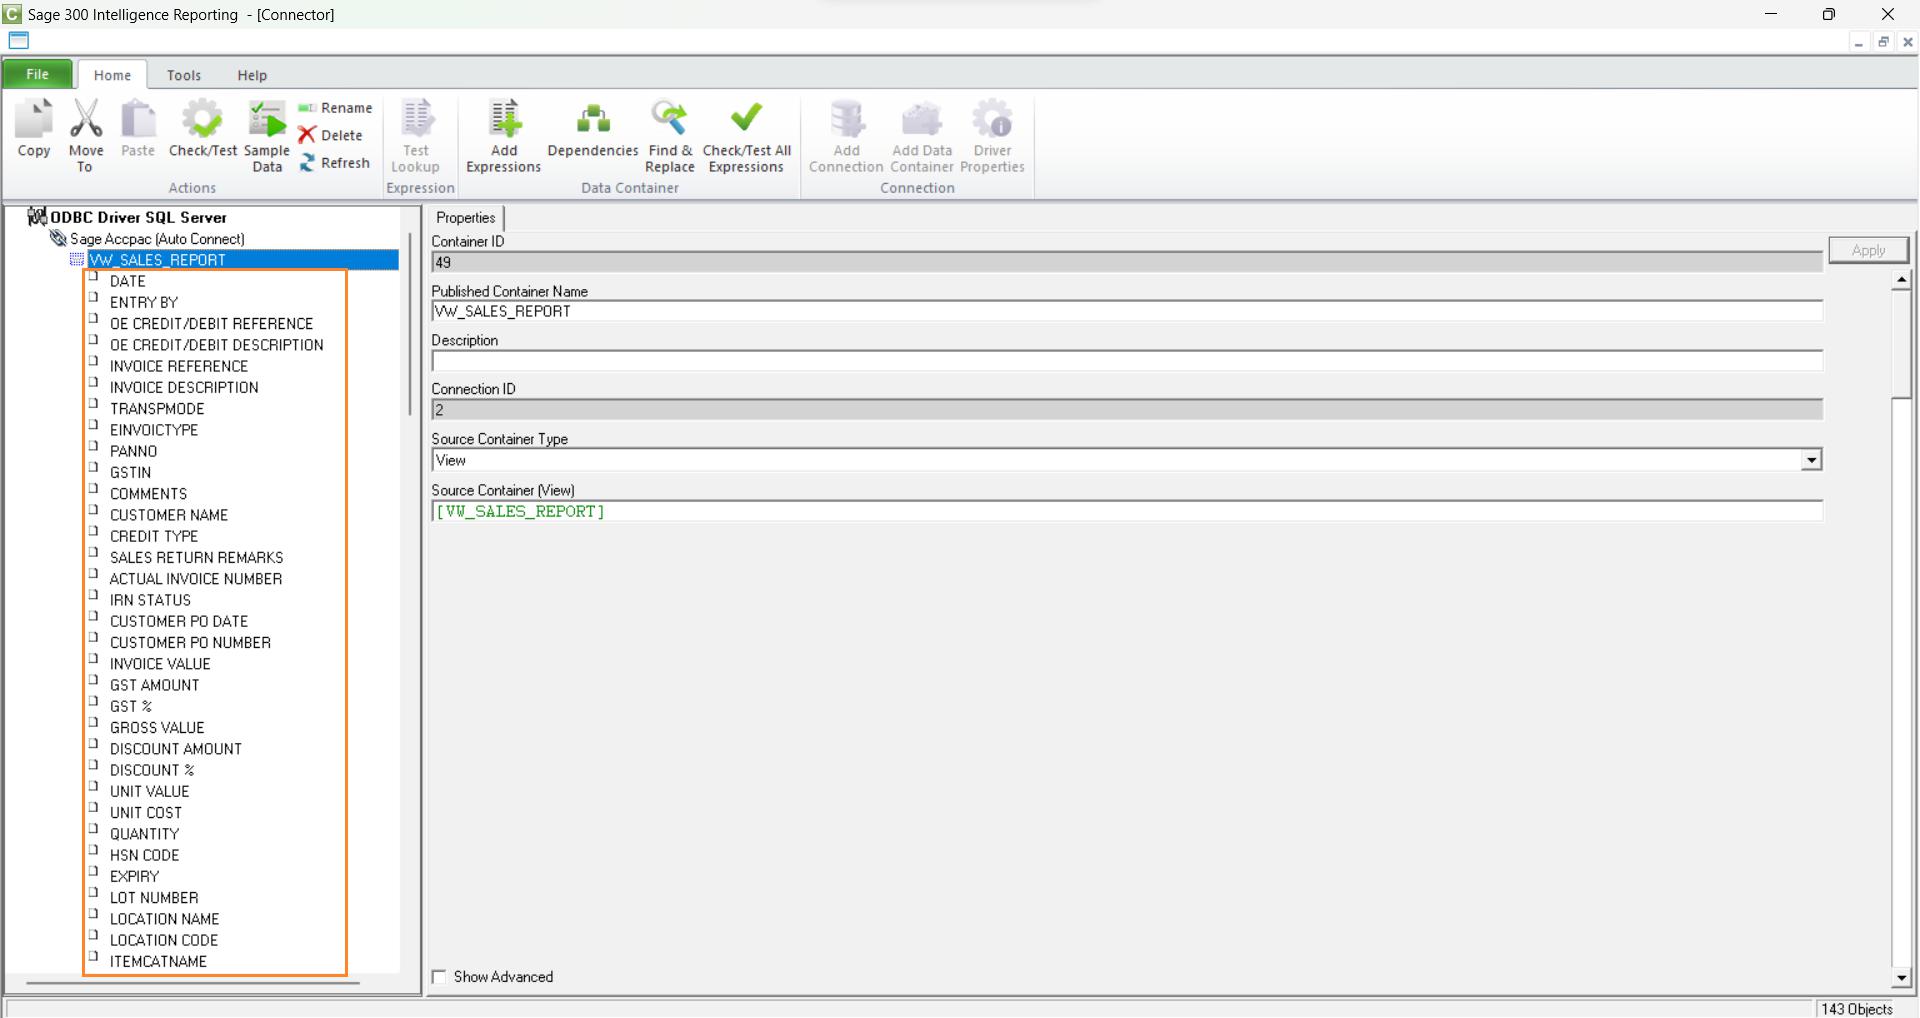
All the Tables will be visible under the report which we have added through the expression.
⇒ Below is the image for your reference :
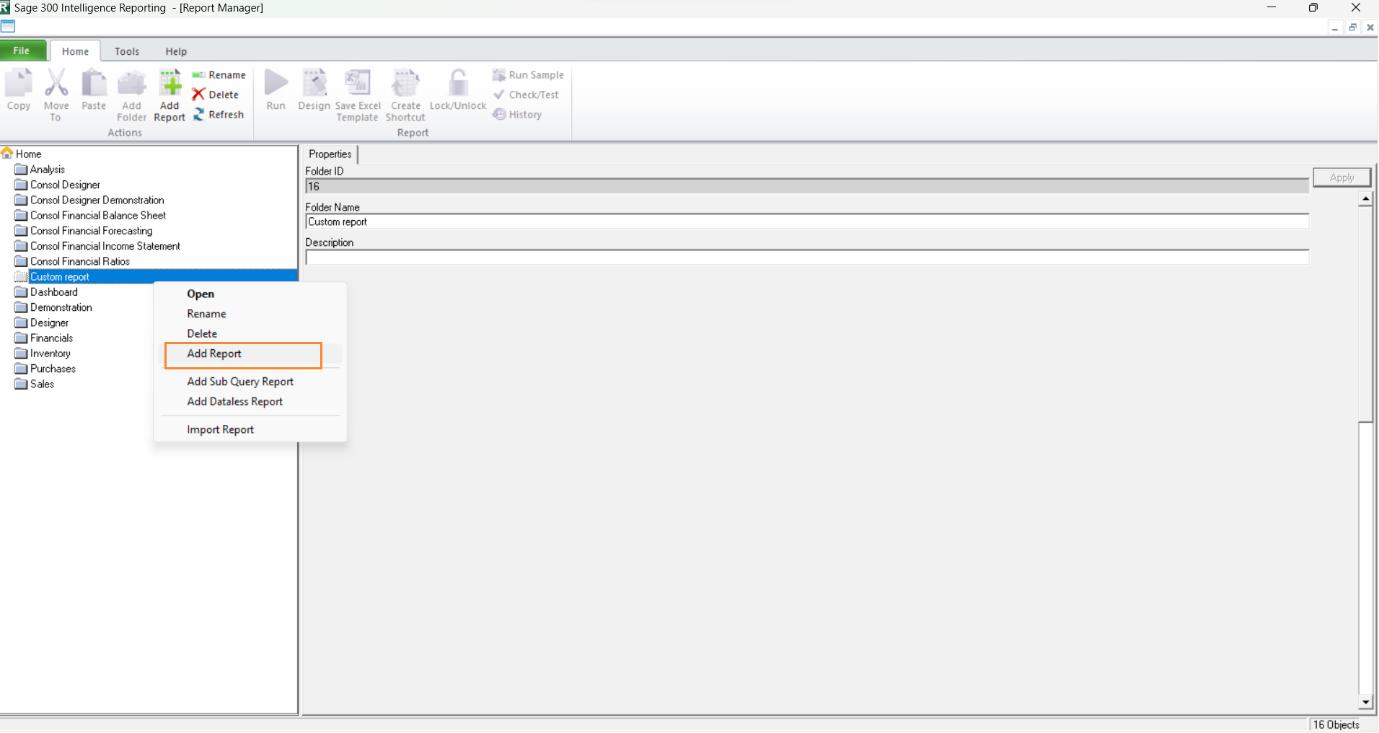
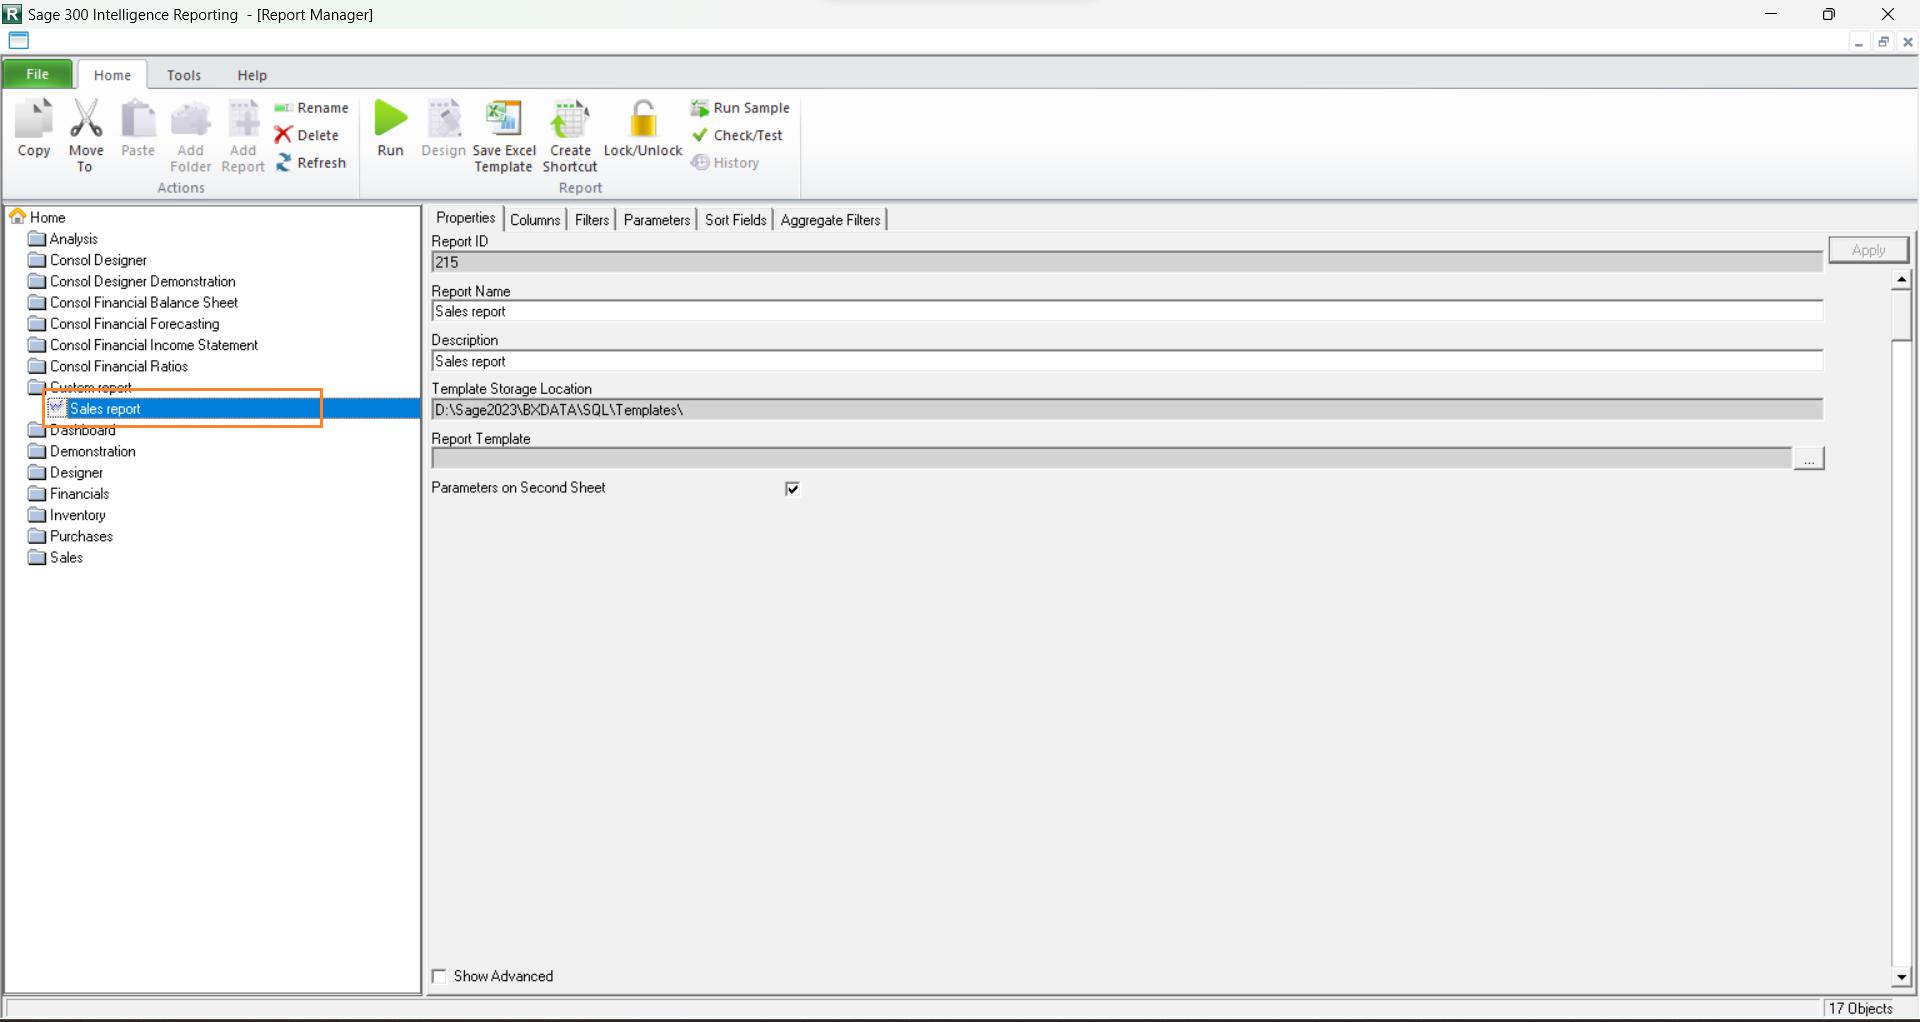
Now we will open the BI Report Manager, here we will create one folder named ‘Custom report’ and add the report which we have incorporated in the BI connector.
Right-click on the folder which we have created and click on the ‘Add Report’ option to add the report
⇒ Below is the image for your reference :
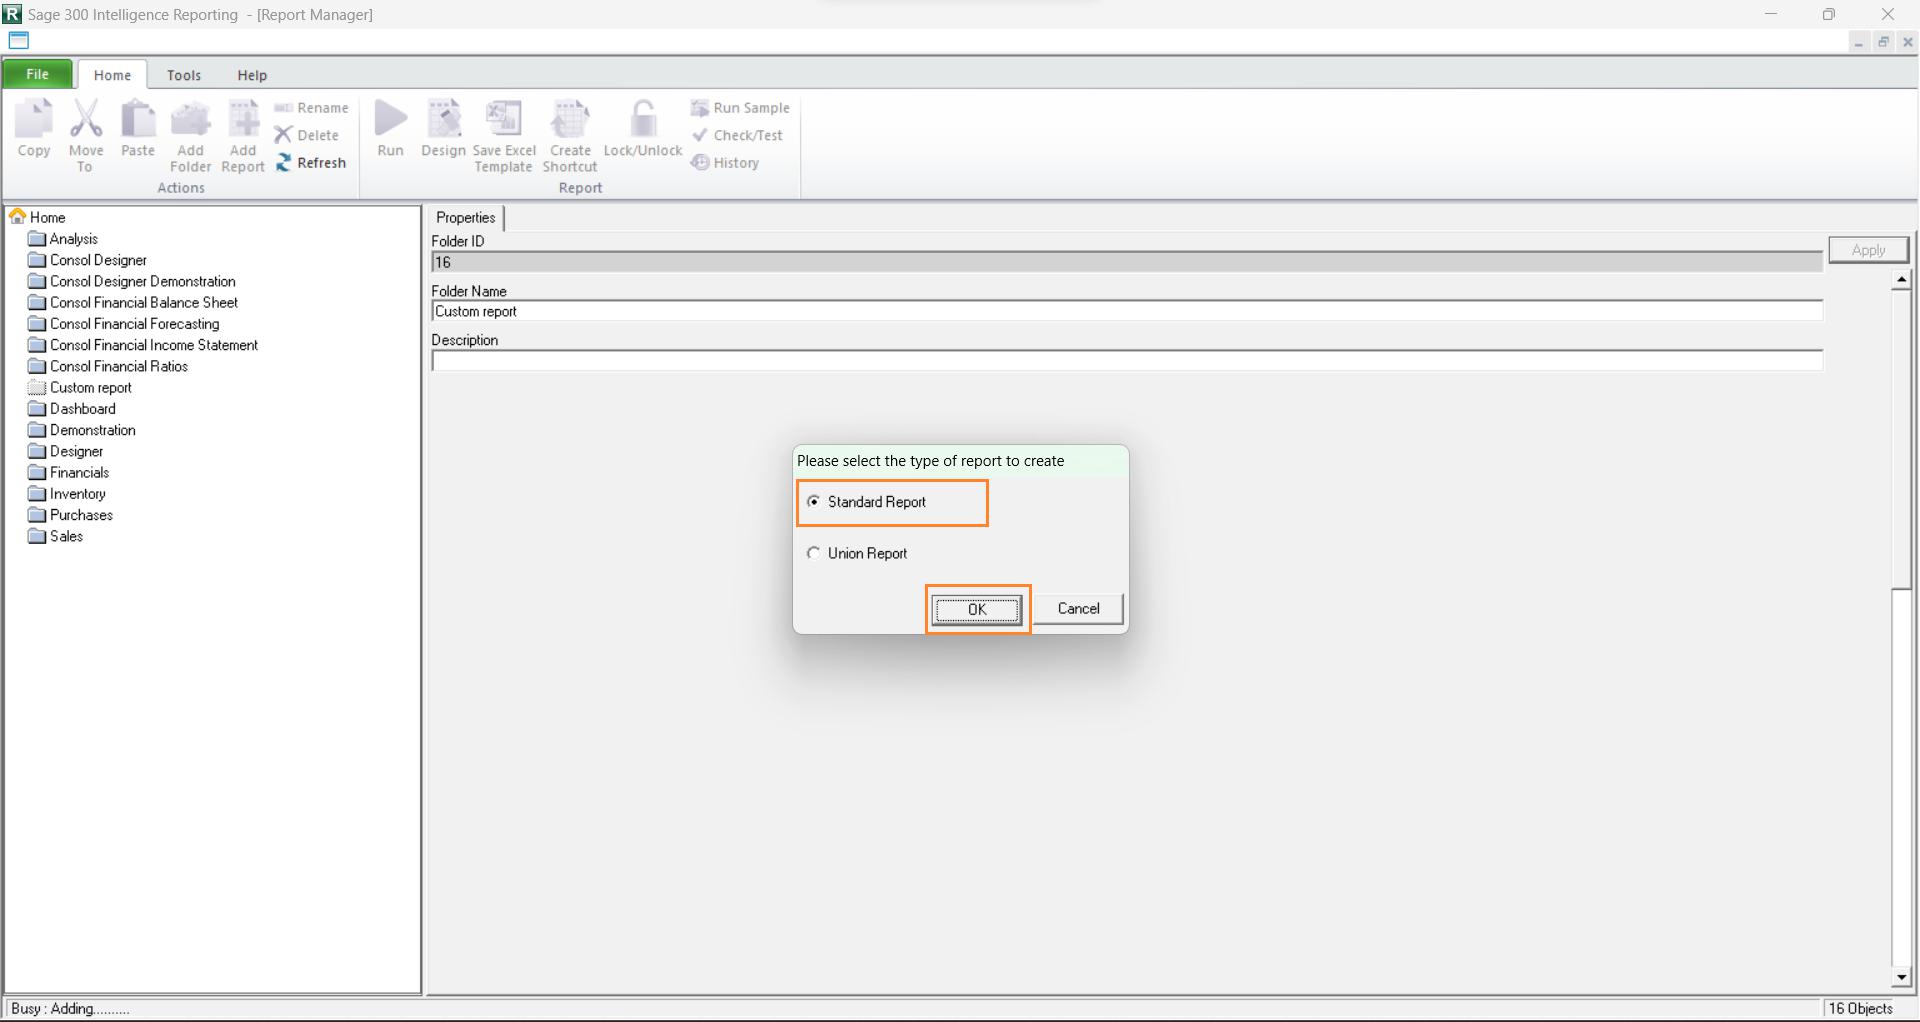
Select the first option i.e. Standard Report and click on OK.
⇒ Below is the image for your reference :
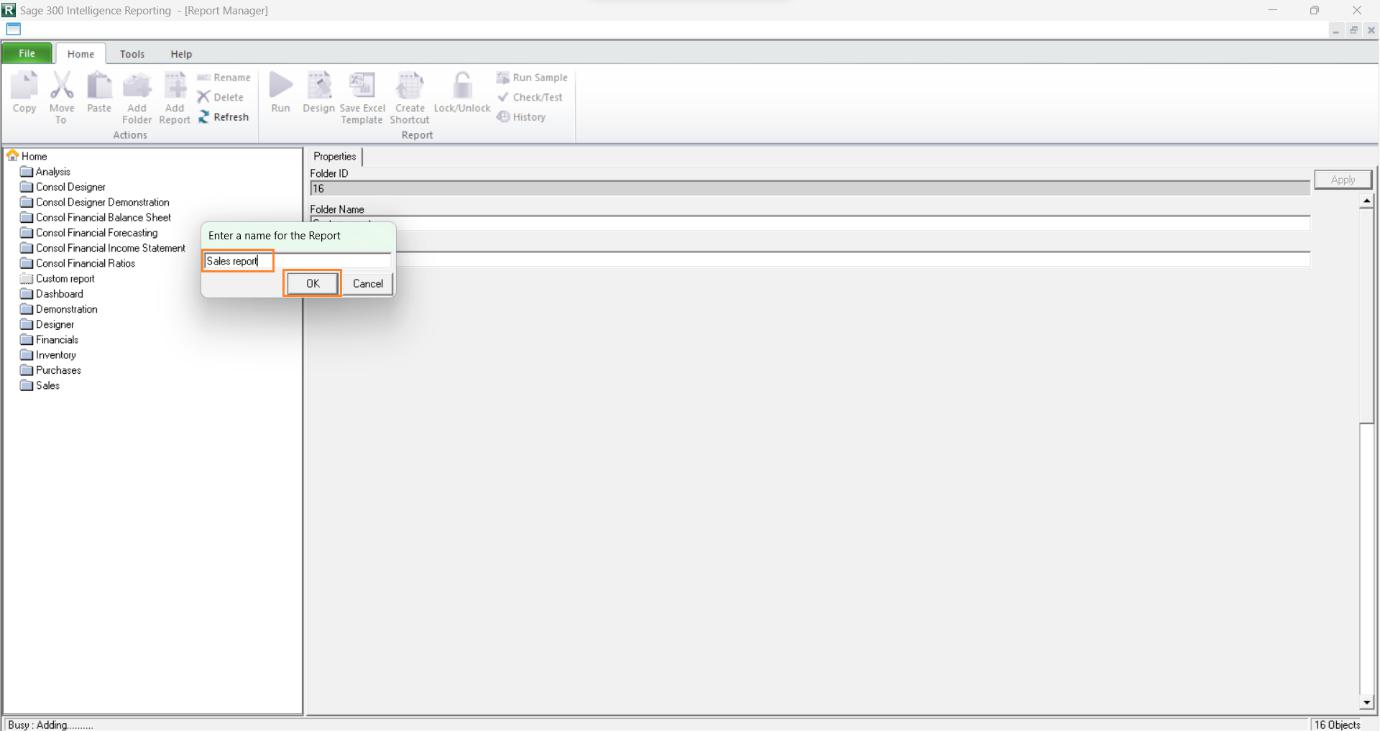
Then we will give the name to the report i.e. Sales report and click on the OK button.
⇒ Below is the image for your reference :
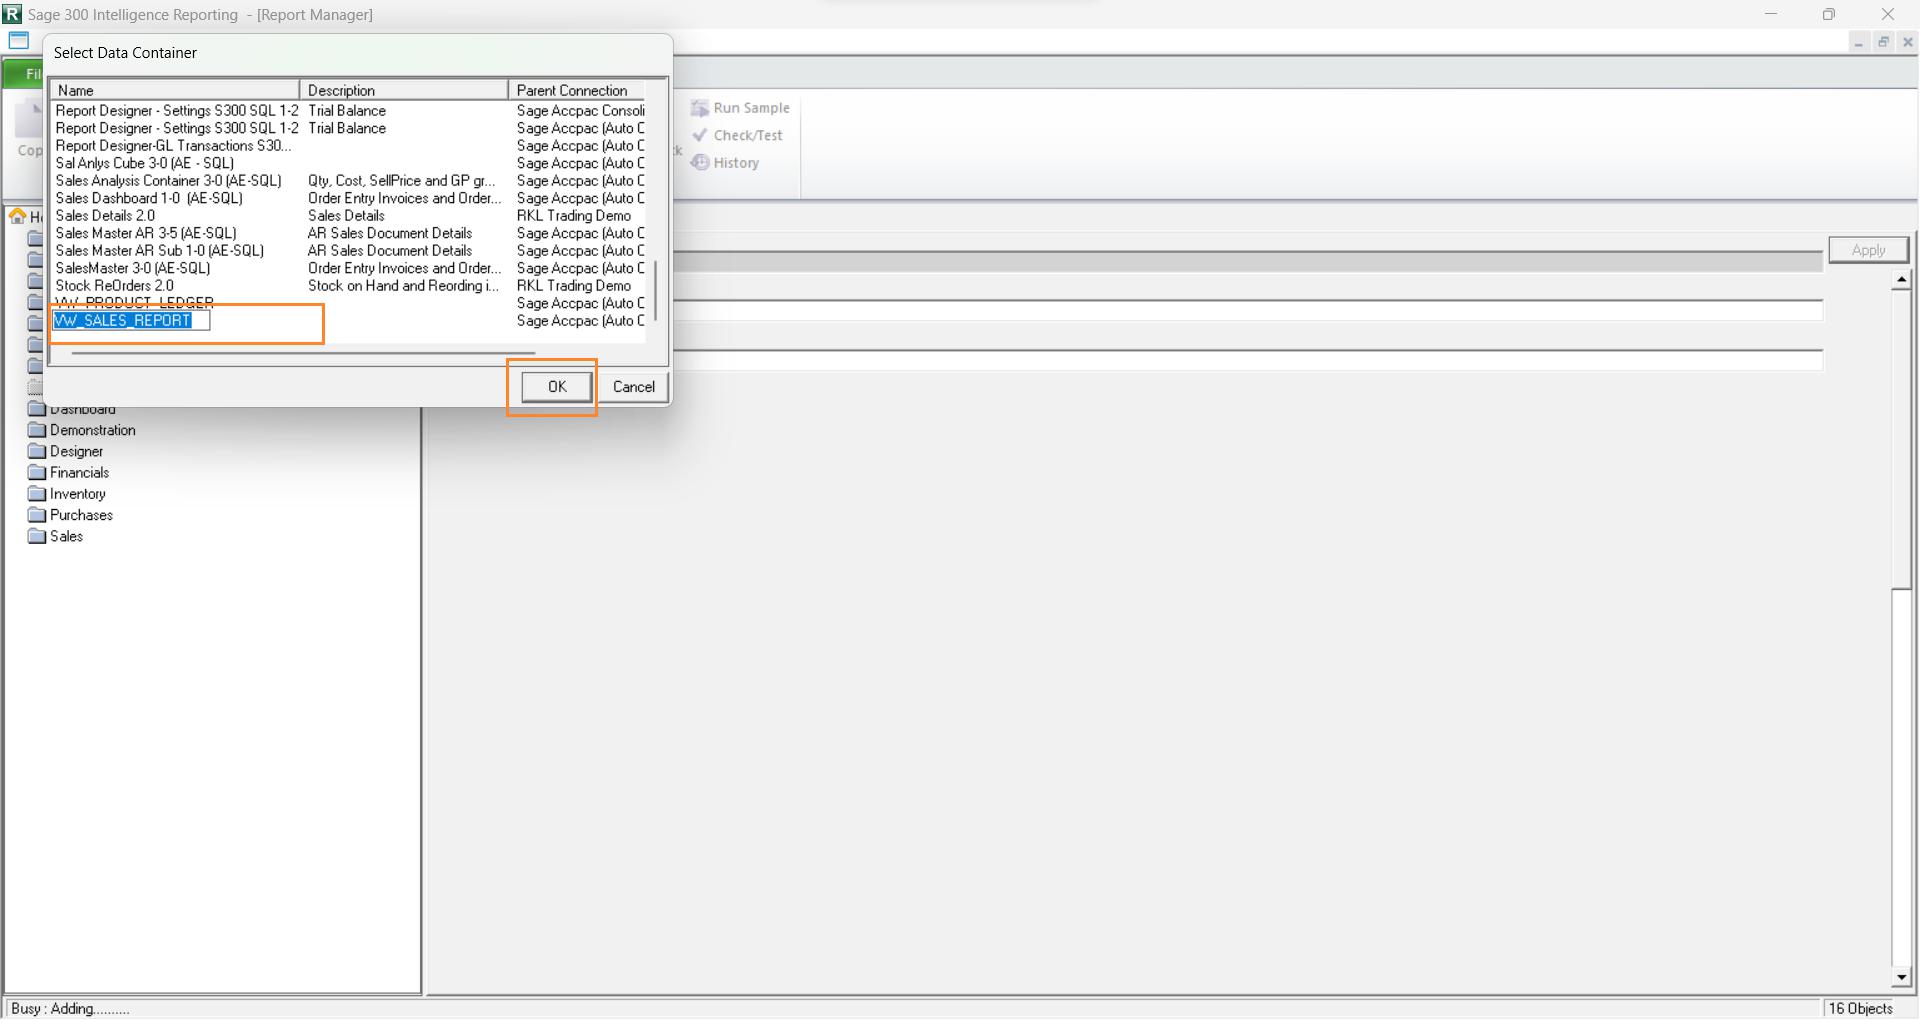
Then locate the SQL query name i.e. ‘VW_Sales_report’ and select the same and click on the OK button.
⇒ Below is the image for your reference :
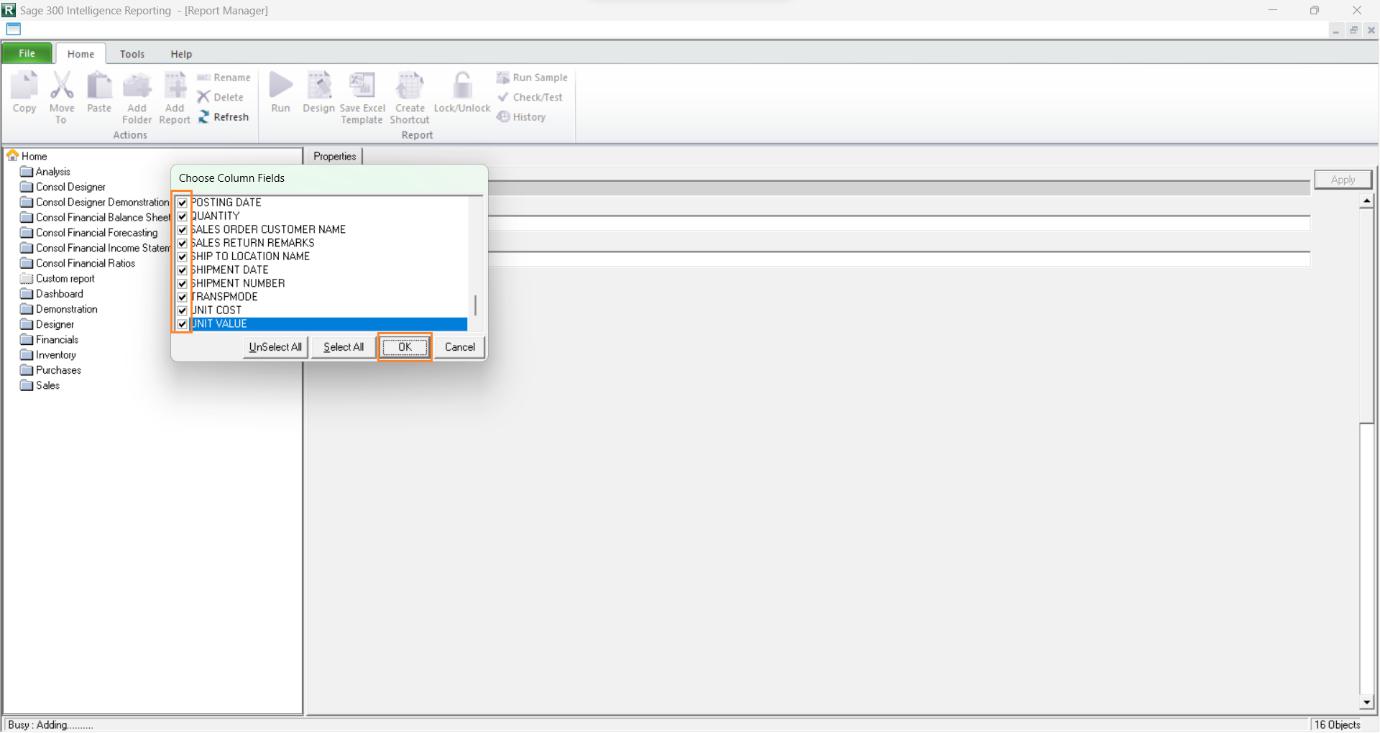
Select all the options and click on the OK button to add the report to the Custom Report folder.
⇒ Below is the image for your reference :
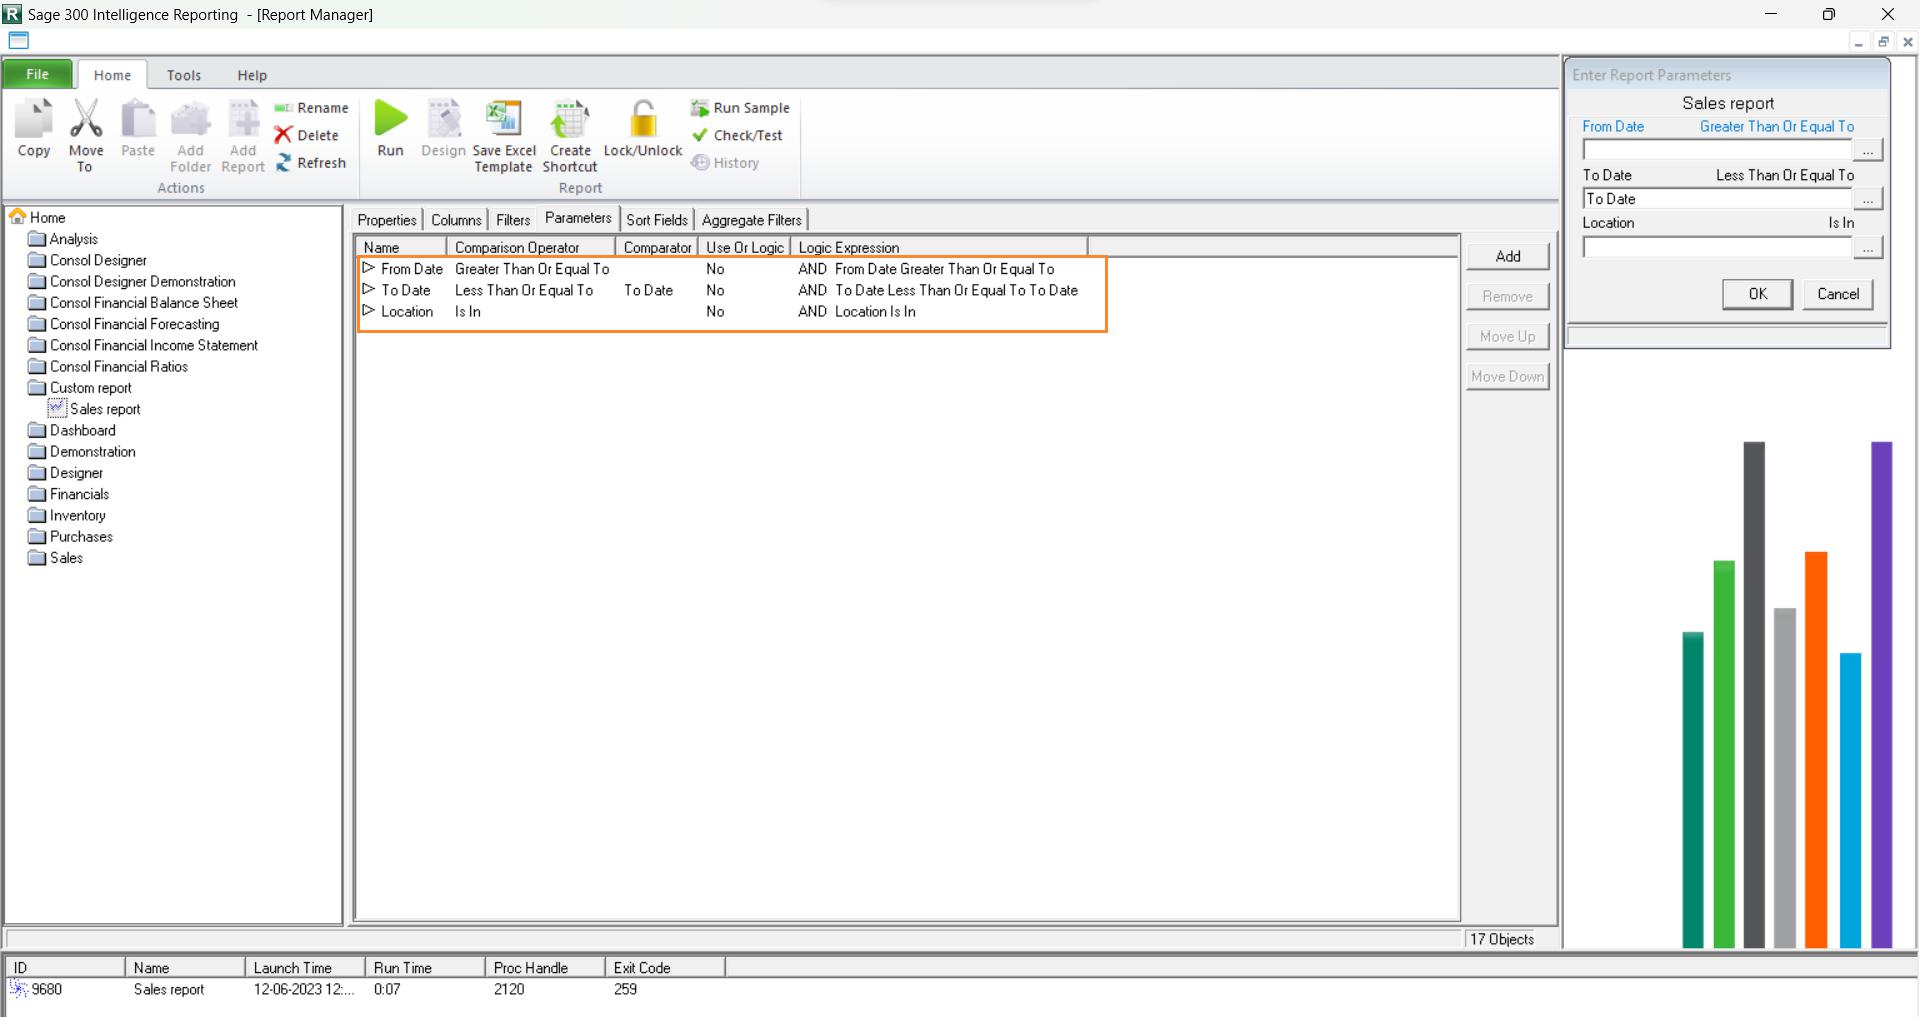
Now the report has been added to the custom report folder and you can add the parameters and column sequence and many more as per your requirement for extracting the report in Excel. Here we will add the Date and Location criteria to extract the report.
⇒ Below is the image for your reference :
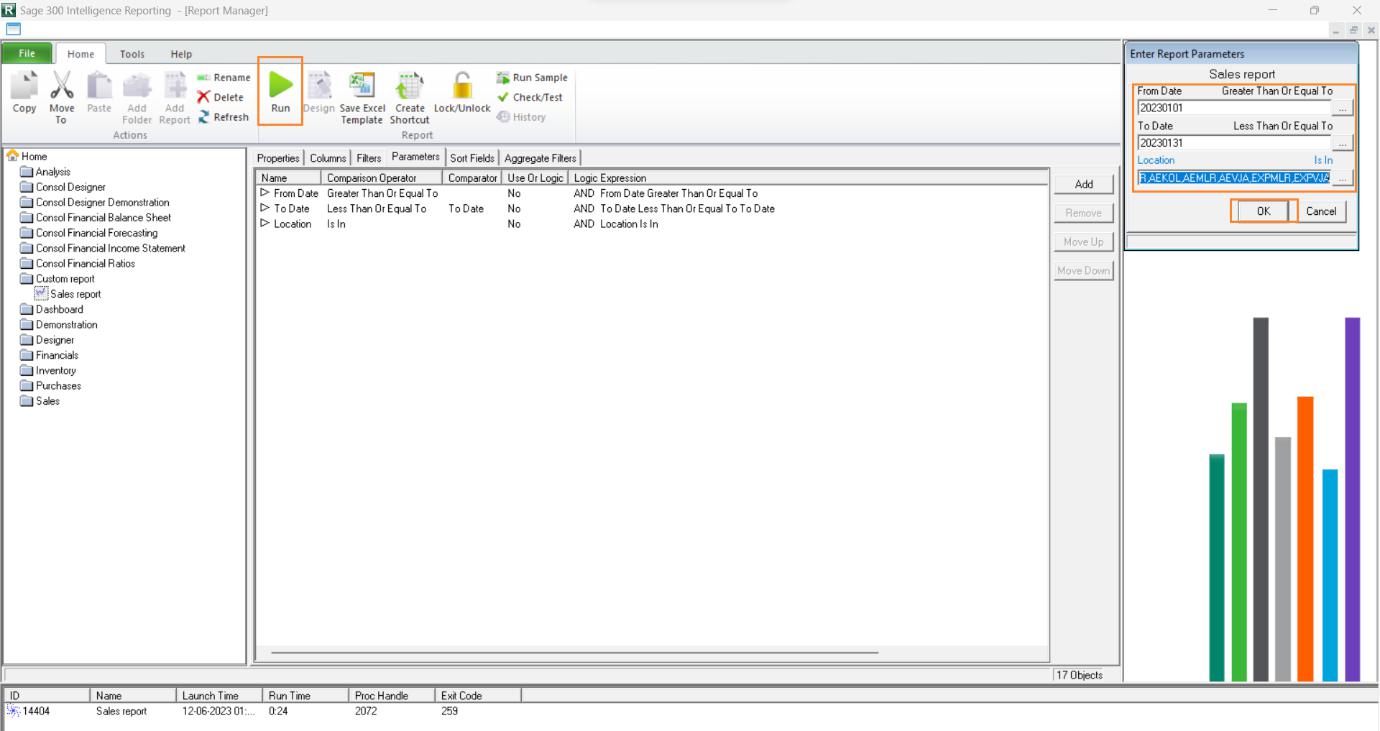
Once all the configuration is done click on the Run button to run the report and give the values in the parameter and click on the OK button to generate the report.
⇒ Below is the sample report for your reference which is generated from the Sage 300 Business Intelligence report :