
Best Business Intelligence Software to Transform Raw Data into Actionable Insights
Aggregate raw data from different sources and transform it into quick actionable insights for better decision-making with Business Intelligence Software
What is Business Intelligence Software?
Business Intelligence (BI) software is a dedicated business tool that collects, filters, analyzes, organizes, and processes unstructured data from different aspects and provides a holistic analysis of all the business operations through intuitive charts, actionable reports, and customized dashboards.
The Business Intelligence module of the ERP software compiles data from multiple sources and offers access to powerful data visualization tools that convert raw data into actionable insights. It transforms your traditional business processes, eliminates inefficiencies, and helps you uncover trends in large datasets.
Why Choose Sage Business Intelligence Module?
In today’s fast-paced business environment, gaining efficiency & accuracy in business operations is critical. Many growing businesses like yours choose Sage X3 to tackle business complexities and make smarter decisions. It’s a single platform to transform raw data into actionable insights and promote data-driven decision-making.
Here’s why leading Indian businesses choose the BI tools in Sage X3 while dealing in today’s rapidly evolving market:
- Transform raw data into meaningful insights, and identify trends, patterns & anomalies
- Predict market shifts, customer behavior, and changing trends through advanced data analysis and visualization tools
- Get a visual overview of your business operations through intuitive charts, reports, and customized dashboards
- Predictive analysis, machine learning capabilities, and data intelligence capabilities
- Predict future growth and control expenditures with advanced budgeting & forecasting tools
Types of Business Intelligence Tools (BI Tools)
Business Intelligence Tools (BI Tools) can be broadly classified into the following types:
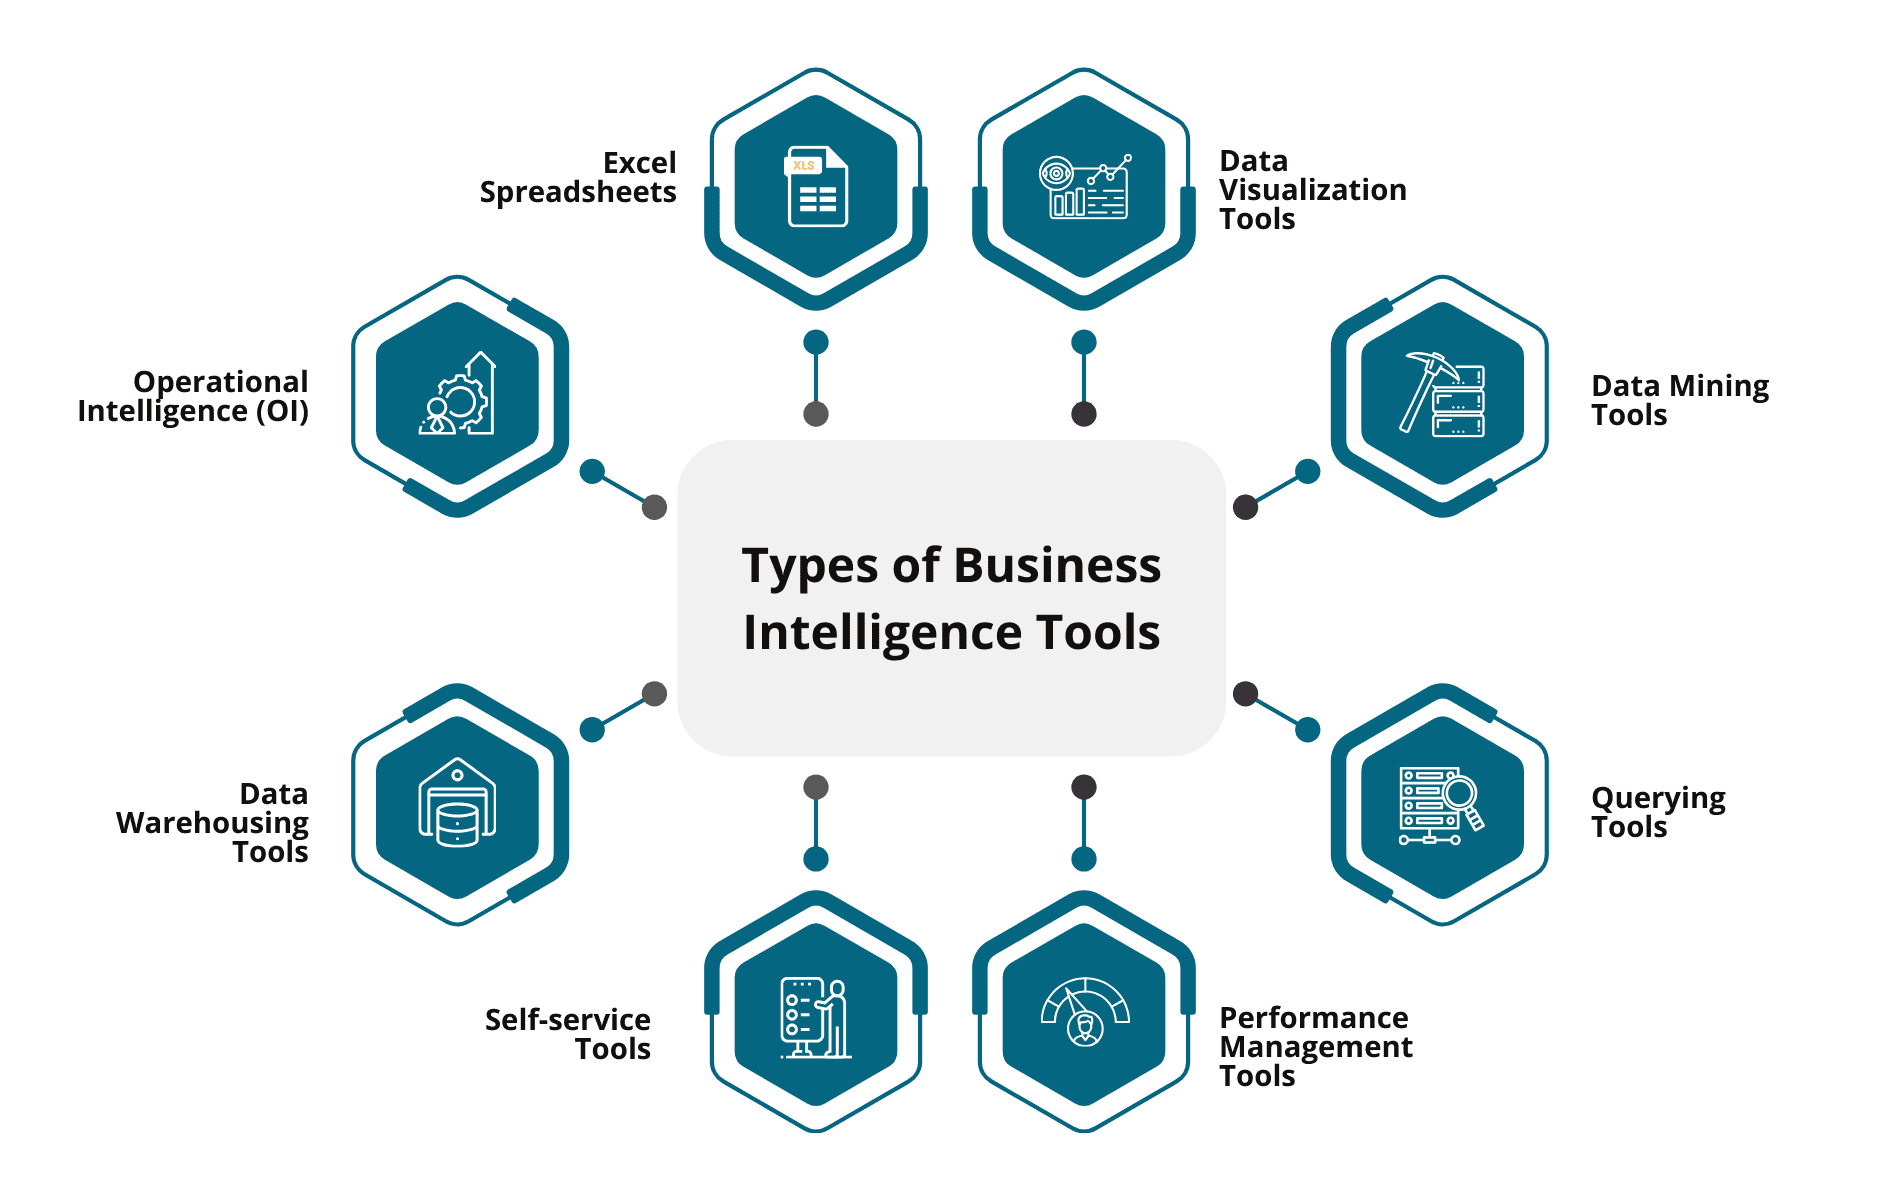
1. Excel Spreadsheets
Excel and Google Sheets spreadsheets are one of the most commonly used BI tools. Many companies across the world use them for visual analysis and to build data models. Businesses can also leverage various free and paid Excel templates available on the Web.
2. Data Visualization Tools
Data Visualization Tools help with the visualization of your data to obtain meaningful insights and quickly share them in business meetings. They provide an intuitive graphical interface to turn complex data into simple-to-understand graphical representations.
3. Data Mining Tools
Data Mining Tools are used in combination with Machine Learning (ML) and Artificial Intelligence (AI) tools to mine massive datasets and unveil trends & patterns. In simple words, it turns complex data sets into clear, refined & human-readable information.
4. Querying Tools
The primary purpose of the Querying Tools is to help users extract valuable information pertaining to sales, finance, and inventory from the ERP database using a Query Language. It gives users the ability to sort, filter, and reorganize information as per their requirements.
5. Performance Management Tools
These are primarily used by the senior management (executive-level leaders). The purpose of these types of BI tools, is to compare the target performance with the actual using Key Performance Indicators (KPIs). They are helpful in understanding the effectiveness of the new strategies adopted by the management.
6. Self-service Tools
As the name describes, these tools are designed to allow data analysts to analyze a large chunk of data without relying on the company’s IT department. These tools are easy and beginner-friendly. They are primarily meant to be used by anyone without technical knowledge.
7. Data Warehousing Tools
Data Warehousing Tools consolidate data from different sources and departments across your organization and store it in a single database. Executives can get up-to-the-minute information about any business process using BI Tools without needing to consult the departmental head or lower-level employees.
8. Operational Intelligence (OI)
Operational Intelligence (OI) is used to get quick insights into business operations, bring agility into the company’s decision-making, and improve competitiveness. They address specific departmental issues such as customer-centric issues for the support department, distribution issues for the logistics department, and so on.
Features of Business Intelligence Software
1. Intuitive Charts
Business Intelligence Software extracts raw data from different sources and converts it into intuitive charts, reports, customized dashboards, and actionable insights. It helps decision-makers get a thorough understanding of the business operations, and find trends, patterns & seasonal fluctuations.
2. What If Analysis
What If Analysis is an important aspect of strategic planning and decision-making. Business Intelligence Software assists decision-makers in understanding the potential impacts of their future decisions using Predictive Analysis, Artificial Intelligence, and similar technologies. As a result, decision-makers can make informed decisions and reduce the negative impact of their decisions on the business’s health & operations.
3. Legacy Integration
Some businesses prefer to use Business Intelligence Software alongside their legacy tool. Business Intelligence Software integrates with your legacy system to ensure seamless data sharing and exchange of information in real time. You can track the progress using various Key Performance Indicators (KPIs).
4. Data Security
Another key feature of Business Intelligence Software is data security. Business Intelligence Software comes into three types, viz. On-premise ERP, Cloud ERP, and Hybrid ERP. The cloud type of BI tools, store your organizational data on the vendor’s server while employing stringent industry measures to ensure the data is safe & secure.
5. System Scalability
As your business grows in size and reaches new highs, it needs an efficient system that continues to work smoothly despite an increase in the volume of data and transactions. Business Intelligence Software provides a flexible, scalable, and customizable system to support your increasing business needs and eliminate discrepancies.
Turn Data into Profits with Sage ERP Software
Traditional Business Intelligence Vs Modern Business Intelligence Tools
Now, let us discuss the key differences between Traditional Business Intelligence and Modern Business Intelligence Tools in a tabular format.
| Traditional Business Intelligence | Modern Business Intelligence Tools | |
|---|---|---|
| Method of Deployment | It is deployed on the organization’s IT infrastructure | It is deployed on the vendor’s IT servers |
| Data Accessibility | Employees need to be physically present at the company’s premises | Employees can access the data anywhere & anytime remotely |
| Maintenance & Upgrade | The company allocates a separate team of professionals to look after the maintenance & upgrade of the Business Intelligence Software | The vendor is responsible for the maintenance & upgrade of the BI Software |
| Scalability | Offers limited scalability | Offers scalability benefits as the organization expands in size & operations |
| Data Security | The data is secured and controlled through internal organizational policies | Vendor adopts stringent security policies to meet modern industry standards |
| Data Retrieval Performance | Typically, slower | Faster |
| Legacy Integration | Difficult (Manual setup & maintenance) |
Easier (Faster and automated integration through APIs) |
| Cost | Higher upfront fees & upgrade costs | Lower fees (Subscription-based pricing model) |
| Preferred By | Large-enterprises | Small and medium-sized enterprises |
Benefits of BI Software for Businesses
Why are an increasing number of businesses adopting Business Intelligence Software (BI Tools)? Here are the potential benefits of ERP:
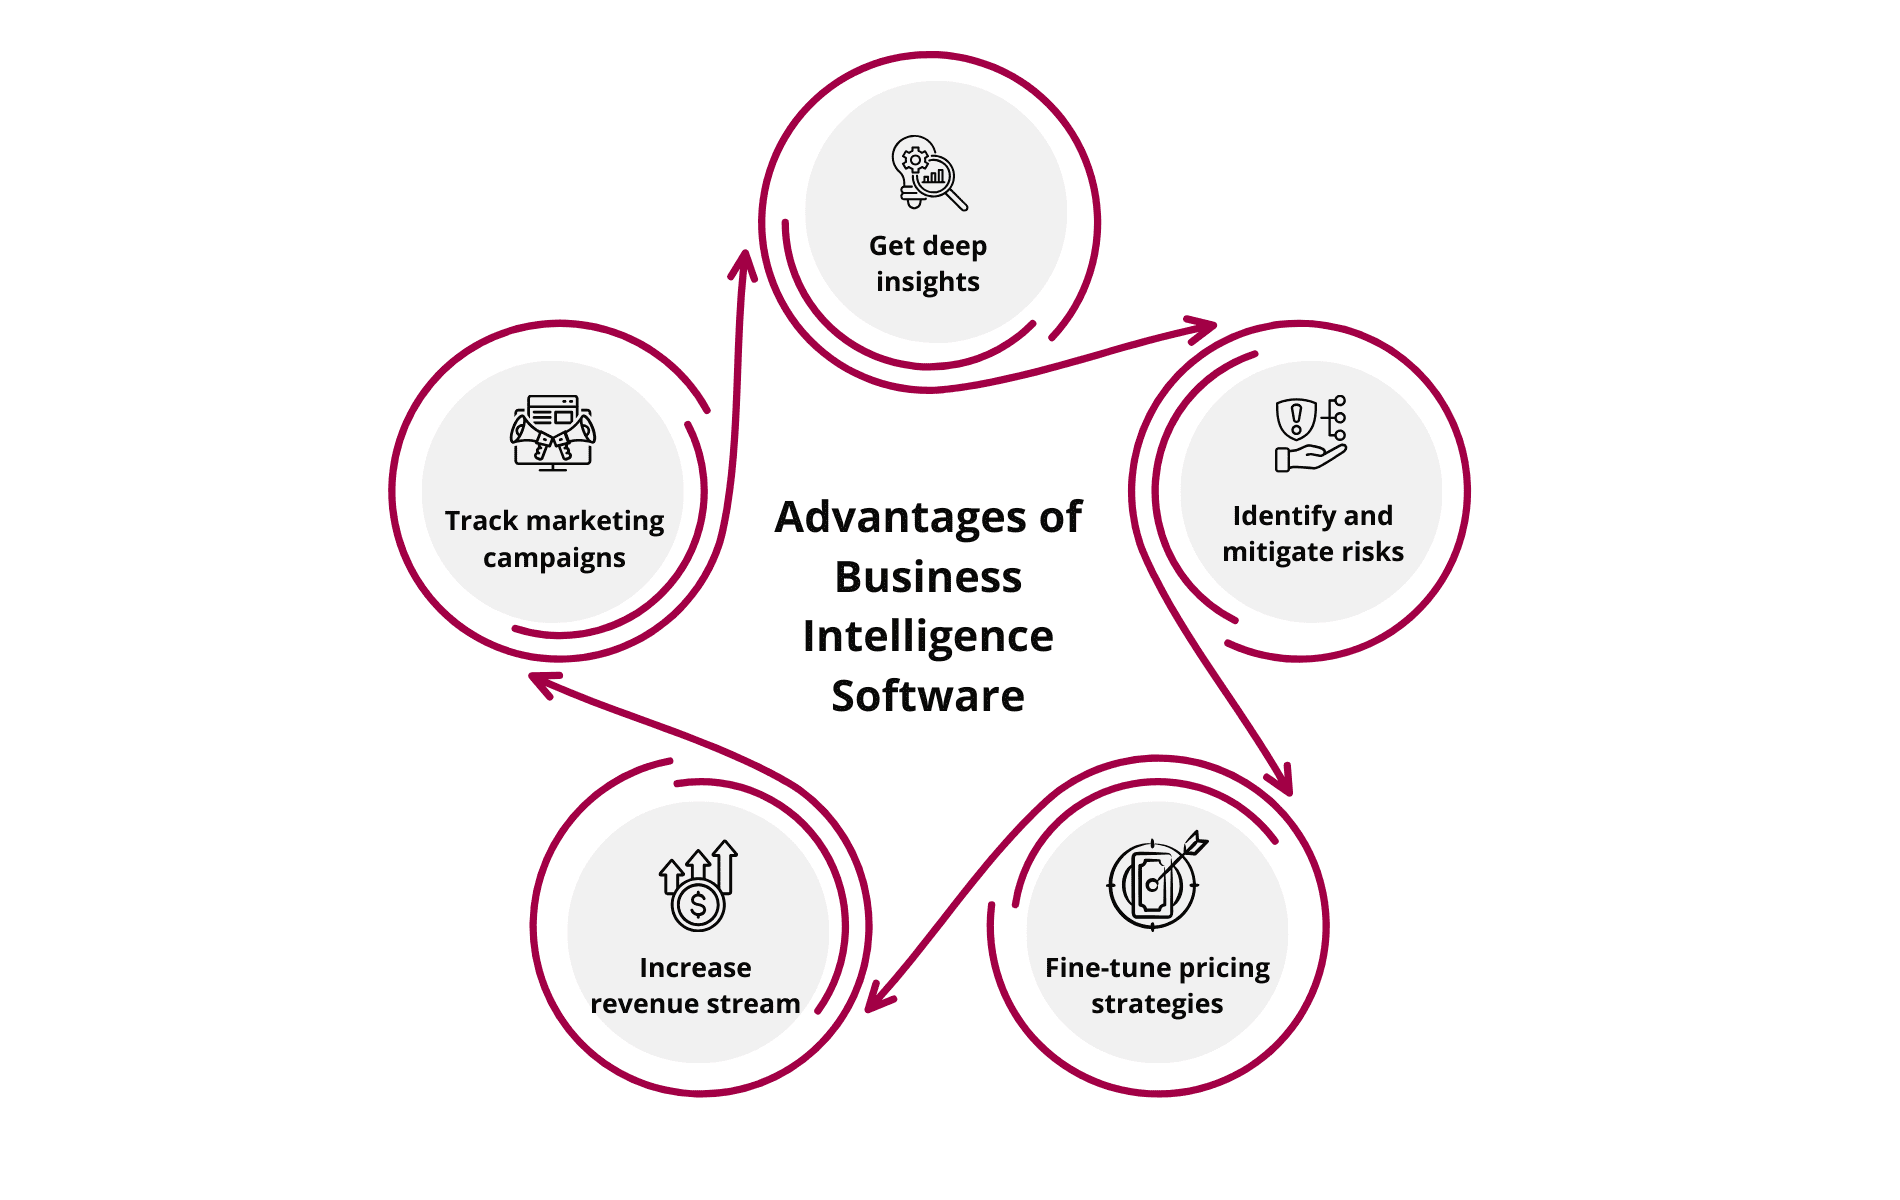
1. Actionable Insights
Business Intelligence Software provides deep insights into business operations and financial statements for making futuristic predictions about consumer demands, sales, revenue streams, and the company’s financial health. They influence the strategic decisions taken by the senior management for business expansion and growth.
2. Better Product Offerings
Without BI Tools, businesses can get a deeper understanding of consumer psychology and factors that influence buying decisions. BI Tools can form better strategies and effectively focus their promotional and marketing campaigns for profit maximization.
3. Mitigate Risks
Risk Mitigation is one of the core benefits of Business Intelligence Software. With a better understanding of the market segment and access to authentic information using BI Tools, decision-makers can take proactive measures to mitigate risks or lower their impact.
4. Track Marketing Campaigns
Marketing campaigns are vital for businesses to build awareness about their brand, increase engagement, and convert leads into customers. The sales management system in BI Tools empowers companies to measure the success of their marketing campaigns, fine-tune their pricing strategies, and elevate customer experience.
5. Increase Revenue Stream
Data is often termed as new oil. Unfiltered & unrefined data may not be very helpful to businesses. BI Tools collect, filter, analyze, process, and turn the raw data into a Single Source of Truth and an invaluable asset. As a result, decision-makers rely on strongly data-backed decisions, rather than gut feelings.
Limitations of Business Intelligence Software
Business Intelligence Tools are incredibly useful and powerful for smart decision-making. However, much like any other technology, it has some limitations:
1. Higher Upfront Cost
Small and medium-sized companies often lack significant upfront capital to invest in business intelligence solutions. Nevertheless, they can go with the cost-efficient Cloud ERP.
2. Unstructured Data
Lack of data cleaning, filtering, and organization before implementing Business Intelligence Software can delay the implementation process.
3. Reliability of Forecasts
The accuracy of your forecasts depends on the quality of the source data. If the source data is incorrect, it can lead to inaccurate predictions.
4. Employee Resistance to Change
Some employees may be reluctant to adopt the new technologies, such as BI tools, despite their tremendous benefits & potential. Employee counseling and training can help.
Roadmap to Developing Successful Business Intelligence Strategy Using BI Solutions
Here are the steps for developing a successful Business Intelligence strategy using BI Software:
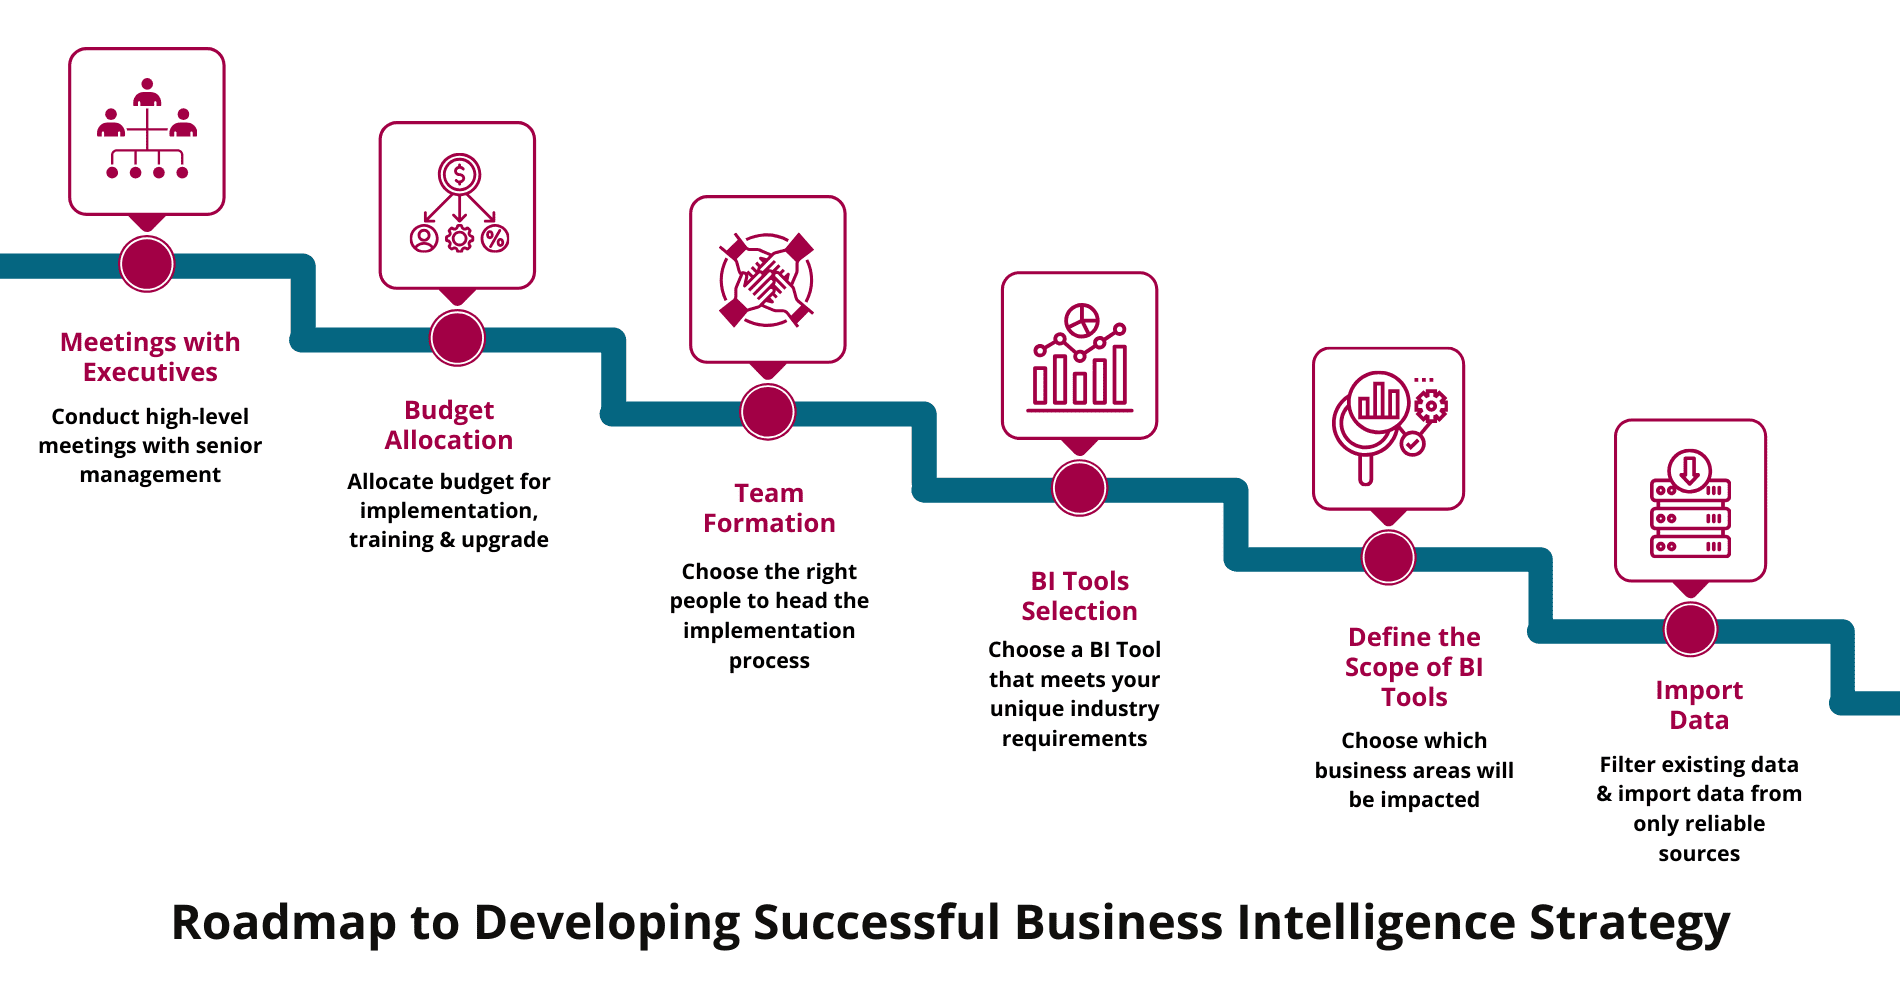
1. Meetings with Executives
First things first, you will need to conduct regular meetings with the senior-level leaders. They will sponsor the cost of the ERP implementation and appoint appropriate employees to look after the entire implementation & post-implementation processes.
2. Budget Allocation
The next step is to allocate a sufficient budget for Best Business Intelligence Tools. Avoid exceeding your budget at all times, and complying with the pre-decided spending. This will ensure a smooth transition to the new system. Remember, you may also incur training and implementation costs in addition to the initial ERP cost.
3. Team Formation
Another important step in developing a successful Business Intelligence strategy is to form teams. These teams may comprise employees from different departments, rather than a specific department to ensure pan-organization successful implementation of the new ERP system.
4. Choose BI Tools
The next step is to choose BI Tools that meet the visions and strategic objectives of your organization and have a positive track record of several years in the industry. You will also want to choose specific ERP modules that can empower specific areas of your business operations. For example, if you’re a manufacturer of toys, your best bet is to opt for manufacturing ERP software. Similarly, if you’re a food producer, choose an ERP for food industry.
5. Define Scope of BI
Defining the scope of the BI Tools is essential to ensure it aligns with the preplanned vision and strategic objectives of your organization. Furthermore, it will help allocate sufficient resources (human, assets, and budget) at each level.
6. Import Authentic Data
The next step is to import data from different sources across your organization. These sources may include numerous spreadsheets, financial reports, and Customer Relationship Management (CRM) tools, among others. It’s important to filter your data before importing to ensure you do not import data from untrusted & unreliable sources.
Key Points to Consider While Choosing the Best Business Intelligence Tools
Here are the key factors that need to be taken into consideration while choosing Business Intelligence Software for your business:
1. Adoption of Modern Technology
Make sure that your Business Intelligence Software supports modern features and capabilities. It should be flexible and scalable. As your business grows, your ERP application should handle the increasing data needs without encountering errors, performance drops, or other disruptions.
2. Cloud Integration
Cloud ERP comes with a Software-as-a-Service model where vendors manage everything from storage, maintenance, and upgradation. Cloud technology has been gaining immense popularity because it allows employees to work remotely no matter where they are and which device they use. Moreover, there are no upfront costs.
3. Vendor Reputation
While choosing the best ERP software in India, it’s important to perform deep research about the vendor’s background such as how long he has been in the market, whether he has a thorough understanding of your industry requirements, and how good has been the after-sales service. Knowing this in detail will help you avoid mishaps in the deployment stage and prevent disruptions.
4. Extended Customizability
When it comes to businesses, there is no “one-size-fits” solution. A good Business Intelligence Software should offer extended customization features so that your business can fine-tune it for its unique organizational requirements. For example, ERP for pharmaceutical industry should offer extended customization options tailored to the specific needs of the pharmaceutical businesses.
5. Legacy Integration
Another factor to consider is the integration of your business management software with legacy systems. Legacy integration aims to boost your employee’s productivity and reduce the time it takes to transfer data between multiple systems. If your Business Intelligence Software offers legacy integration, it will make it easier to share data seamlessly between multiple systems.
Uncover New Opportunities & Trends with Sage X3
Business Intelligence software enables businesses to reduce data complexities, rip the benefits of advanced methodologies, and stay on the front foot of innovation & technological adoption. It automates the key business processes, supports strategic business planning, provides predictive insights, and accelerates data-backed decision-making.
Sage X3 is a must-have solution for businesses that want to build a richer intelligence environment, convert inefficiencies into efficiency gains, and free up employee time & organizational resources for higher strategic endeavors. It serves as a crucial tool to pinpoint operational bottlenecks, and improve the quality of higher-level decision-making, and promote growth & success.
Top Industries Leveraging ERP Software
Food & Beverage
Alcohol
Pharmaceuticals
Advertising
IT Services
Furniture
Manufacturing
Auto Ancillary
Pharma Trading
Packaging
Medical Device
Chemical
Plastic
Brewery
Logistics
Automotive
FAQ of Business Intelligence Software
What is business intelligence in software?
Business intelligence solutions automate the process of data consolidation from unstructured and fragmented sources within your business and provide useful insights for strategic decision-making. Using the best business intelligence tools, decision-makers can dig deeper into long & complex data, discover trends & patterns, and accurately forecast future events.
Who Uses the Business Intelligence Tools?
Best Business Intelligence Tools are used across businesses of all types. However, they are commonly popular across the following professions:
Higher Management: Executives use bi solutions to gain insights into business operations and make data-driven decisions to cut manufacturing costs, and reduce inefficiencies.
Government Bodies: The Govt uses BI tools to analyze & process massive datasets from tax records & public records, and better allocate their resources, and tailor their policies.
Data Analysts: BI Software has proven to be a game-changer for data analysts for importing information from different sources, and visualizing trends & patterns.
IT Engineer: They use bi solutions to determine the operational readiness of their IT infrastructure, mitigate risks, detect user-behavioral patterns, and prioritize essential tasks.
Sales Team: They use the Best Business Intelligence Tools to unveil demand for their products, analyze customer behavior, track sales performance, and comprehensive sales management.
What is the best business intelligence software?
Sage X3 is the best business intelligence software that comes with a robust array of features such as advanced business intelligence, enhanced reporting, user-defined triggering events, deep customizations, and robust integration with your existing legacy tools. It is a one-of-a-kind solution that empowers your business with advanced data analytics, interactive data visualization, intuitive charts, reports, and role-based dashboards. Quickly process mountains of data to find new trends & patterns, and capture new opportunities.
How to know if your business needs modern BI tools?
Here are some potential scenarios that may warrant the need for deploying BI solutions:
- Your data is fragmented across different departments and segregated systems
- You are experiencing heightened spending (example — increased storage costs, inventory spoilage & obsolescence).
- Your business processes are labor-intensive and prone to human errors
- Your business suffers from a lack of standardization, inconsistent data flow, and duplicate entries
- Your legacy system fails to deliver intelligent insights, which are vital to capitalize on new revenue streams
- Your business is over-reliant on obsolete tools that lack real-time synchronization and industry-specific customizations
What are the top 10 business intelligence tools in 2025?
Here’s the list of the top 10 BI tools in 2025:
- Sage X3: Best-in-class ERP to transform raw data into actionable insights, predict demand, plan optimum production output, and enhance visibility & control
- Microsoft Power BI: Leverage AI-driven augmented analytics, find trends & patterns, and discover hidden actionable insights
- Zoho Analytics: Gain meaningful insights with personalized reports & dashboards
- SAP BusinessObjects: Offers self-service reporting, flexible architecture, and powerful integration
- Oracle BI: A flexible tool with powerful data analytics, mobile analytics, automated alerting, and data warehousing capabilities
- IBM Cognos Analytics: Get data visualization & actionable insights, identify hidden patterns, and interpret results
- Google Data Studio: Consolidate data from various sources, get useful insights into interactive & customizable dashboards, and collaborate in real-time
- Domo: Basic data analytics, ad-hoc analysis, collaboration, and data governance
- QulikSense: An on-premise & cloud solution with data visualization, data modeling, and augmented intelligence capabilities
- Tableau: A single analytical platform with intuitive charts, graphs, and reports
What are the Applications of Business Intelligence?
Here are the applications of Business Intelligence (BI):
Strategic Decision-making: Process large datasets, and gain insights into new trends & patterns for quick & informed decision-making.
Predict Future Events: BI analyzes past historical occurrences, reveals key information, and makes foresight to stay ahead of the curve.
Actionable Insights: BI helps decision-makers with business-critical insights by aggregating data from different sources & departments.
Improve Efficiency: BI helps your business identify key areas of improvement, and take strategic measures to improve efficiency & make structural changes.
Compare Scenarios: It simplifies the complex decision-making process by visualizing the impact of potential decisions for risk identification & mitigation.
Which Industries Benefit the Most from Business Intelligence Software?
Business Intelligence Software is used in a wide range of industries. Here are the industries that benefit the most from BI Software:
- Manufacturing Industry: BI Software plays a critical role in providing key insights for effective demand planning, production scheduling, and production control.
- Retail Industry: BI Solutions help retailers improve the effectiveness of their marketing campaigns and automate inventory management operations.
- Food Industry: BI Tools enable food & beverage manufacturers to set better pricing strategies, forecast demand for their food products, and manage perishable items.
- Pharmaceutical Industry: Business Intelligence Software helps pharma companies monitor regulatory aspects, reduce compliance risks, and ensure a smooth supply chain.
- Auto Ancillary Industry: BI Software is used by the auto ancillary industry for production planning & scheduling, quality control, and ensuring optimum utilization.
How is AI used in business intelligence?
Best business intelligence tools come with AI in ERP, which eliminates manual labor work in various data-centric processes such as data handling, research & analysis. It automates routine tasks so that your employees can focus on more strategic operations. It delivers comprehensive insights into your company’s operations and improves the accuracy of your forecasts through historical data analysis and trend identification capabilities.
What is the Difference Between BI and Data Analytics?
Business Intelligence (BI) primarily relies on descriptive methods of analysis. It analyzes historical data and performs a comprehensive analysis to identify trends & patterns, performance gaps, and areas of improvement. In contrast, Data Analytics uses various methods such as descriptive analysis, predictive analysis, prescriptive analysis, and diagnostic, among others. It is primarily used by data scientists as it requires extensive experience in data science.
What are the examples of popular BI software?
Here are the examples of BI tools :
- Sage X3
- Microsoft Power BI
- Zoho Analytics
- SAP BusinessObjects
- Oracle BI
- IBM Cognos Analytics
- Google Data Studio
- Tableau
What are the Key Functions of Business Intelligence Tools?
→ Data Collection and Integration: Consolidate data from different sources and get a unified view of information inside a single interface
→ Data Analysis: Analyze large volumes of information, identify trends & patterns, and perform predictive analytics
→ Data Visualization: Convert large, complex data into small actionable insights for smart querying and reporting
→ Reporting & Dashboards: Get intuitive charts, reports, and custom dashboards for smart decision-making
→ Performance Monitoring: Monitor your business performance and track performance against targets through the use of Key Performance Indicators (KPIs)
→ Predictive & Advanced Analytics: Identify potential business outcomes to identify potential business opportunities and manage risks better
→ Data Governance: Comply with global data security standards with high-grade encryption and role-based data access
→ Collaboration & Sharing: Enable access to the most recent and up-to-date information across different individuals and teams