What is FSN analysis?
FSN analysis is an inventory classification method based on how quickly the stock items are consumed or sold. FSN stands for Fast-moving, Slow-moving, and Non-moving inventory categories. It is one of the most commonly used techniques to make well-informed inventory decisions in factories and warehouses.
To accurately classify items, the inventory turnover ratio (ITR) is calculated for each product. This ratio identifies the rate at which a product is sold over a specific period. If the product has a high ITR, it is classified as fast-moving. Likewise, slow-moving and non-moving items have low and zero ITR, respectively.
Parameters of FSN Analysis
In the FSN Analysis Inventory Management technique, the main goal is to reduce material costs, labour costs and turnover costs. And here are some parameters of the FSN analysis :
- The consumption rate of a product – In a given period, the percentage consumption rate, at which stocks get expended or replenished.
- The average stay in inventory – The average percentage stay of each item in the inventory, till the time it is sold.
- Period of analysis – Specify when you are conducting inventory analysis, whether in six months or in a year.
The inventory turnover ratio for fast-moving items is more than 3, for slow-moving items, it is between 1-3 and for non-moving items it is less than 1.
Classification of FSN Analysis
FSN analysis can be expanded as Fast-moving, slow-moving and non-moving inventory management. This type of inventory analysis is one of the best ways to manage, monitor and control inventory.
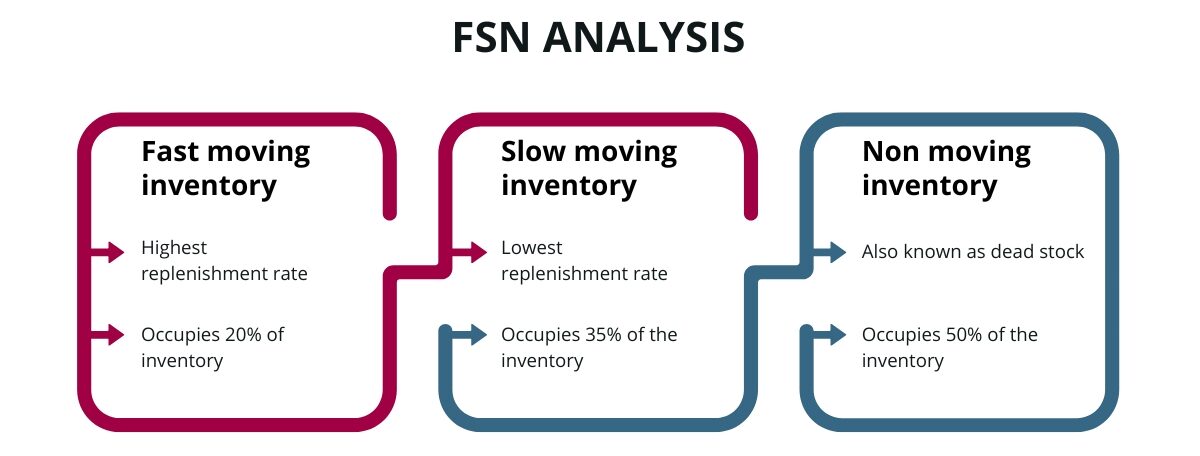
Fast-moving inventory
Fast-moving inventory includes products that sell faster and in high quantities. If not managed well, these products can quickly go out of stock. So these items have the highest replenishment rate and need to be ordered frequently. For example, for an automobile manufacturer, fast-moving items can include oil filters and brake pads. So in this category, the items comprise less than 20%.
Slow-moving inventory
Slow-moving inventory items are products that are low in demand and move out of stock at a slower rate. They have a low replenishment rate and require careful monitoring to prevent overstocking. This category includes about 35% of the inventory. For example, an engine control unit (ECU) for a specific car model not manufactured frequently.
Non-moving inventory
Here, the inventory moves at the lowest rate or does not move at all. Since these items are not in demand, they lose value and are classified as dead stock. It covers almost 50-55% of the items stored in the inventory. An example of non-moving inventory is a dashboard panel for car models no longer in production.
How to conduct FSN Analysis?
FSN analysis is functional for effective managing of the total inventory, order fulfillment process, inventory space management and reducing inventory costs.
The FSN analysis for inventory control can be done by following the below steps :
- Step 1: Make an inventory item list and calculate the annual demands, unit price and annual consumption rate of each product.
- Step 2: The existing inventory items should be arranged in decreasing order of the inventory based on their annual usage.
- Step 3: Calculate the percentage of annual usage and the average cumulative stay and percentage of annual usage for each of the existing inventory items.
- Step 4: Group the inventory under the F, S, and N category. It is done depending on the cumulative percentage of annual demand.
The following data should be collected to perform the FNS analysis effectively –
- Name
- Turnover ratio
- The annual demand for a specific item.
- Unit price of each product.
- Annual usage of each item.
- Cumulative consumption rate of each product.
Note that the turnover ratio is calculated using this formula :
Turnover ratio formula = Annual demand/ Annual inventory
Next, the annual usage of each inventory product is calculated after calculating the annual percentage usage of each inventory item.
Here is the formula to calculate annual usage –
Annual Usage of each item = Annual Demand of each item * Unit Price of each item
Calculate the cumulative percentage of the usage of each item with this formula.
Cumulative percentage usage of first item = Annual percentage usage of the first item
Cumulative percentage usage of 2nd item = Cumulative percentage usage of 1st item + Annual percentage usage of 2nd item
So, after all these calculations, the inventory products are segregated into their allotted classes – fast-moving category, slow-moving category and non-moving category.
According to the inventory and consumption rate, 70% is the fast-moving inventory of the annual consumption rate, 20% is the slow-moving and 10% of the items cover the average consumption rate.
Also Read : What is ABC Analysis in Inventory Management System?
Advantages of the FSN Analysis Technique
FSN analysis is effective in getting a better understanding of the inventory and its computation of the average stay of each item in the inventory. And the products are classified based on the parameters mentioned above.
Let’s discuss more advantages of FSN analysis :
- FSN analysis is efficient to get a find dead stock and reducing its overstay in the inventory.
- A particular technique to effectively manage the inventory will change the behaviour of the supply chain process.
- A successful method to find the active goods in the inventory. If the FSN analysis is closely inspected, the shifting trend from one product to another can be closely monitored.
- It helps retailers to make better decisions regarding the product’s future benefits for the business helping them to adjust their strategies accordingly.
- It helps in reducing inventory carrying costs such as storage, insurance and depreciation, and eliminates stock overstays.
- An effective method to increase revenue is by focusing on fast-moving goods and reducing the production of slow-moving or non-moving products.
Disadvantages of the FSN Analysis in Inventory Management
There are multiple benefits to this technique But it’s not free of disadvantages. To segregate the products there are more calculations with multiple formulas. If any error occurs in one of the calculations, it will be a faulty outcome. For example, due to miscalculations, you may ask a supplier for more slow-moving products assuming them to be fast-moving and later regret the action when the demand dips.
In addition, frequent changes in product trends impact the business, so the inventory manager may find it difficult to compute the product analysis more often.
What is the reason for slow-moving and non-moving inventory?
Let’s discuss some of the reasons for slow and non-moving inventory.
- If the production team failed to inform about the requirements of the modified raw materials list, it may compromise the quality of goods resulting in going under the slow-moving or non-moving category.
- If the inventory is not reviewed periodically, the production team will unnecessarily manufacture obsolete goods.
Conclusion
FSN analysis helps in classifying inventory analysis based on consumption rate. It is an effective method to understand and articulately forecast demand. It is useful for analysing fast-moving, slow-moving goods and non-moving items. It also helps in making data-driven decisions for the company which will help in increasing profits.
To know more about ERP and what ERP solution is best suited for your industry and business vertical, you can also write to Sage Software Solutions at sales@sagesoftware.co.in
Upscale your Business and book a demo session now!

FSN Analysis FAQs
1. What is FSN Analysis in Inventory Management?
FSN analysis classifies inventory into Fast-moving, Slow-moving, and Non-moving categories based on their consumption pattern. This helps businesses to optimize stock levels and minimize their inventory carrying costs.
2. What is the difference between ABC and FSN analysis?
ABC Analysis categorizes inventory based on value (A-High value, B-Medium Value and C-Low Value). On the other hand, FSN analysis focuses on consumption rate and inventory turnover rate, i.e. how fast the inventory is consumed or sold.
3. What are the Components of FSN Analysis?
The core components of FSN Analysis are its three categories: fast-moving items with high turnover, slow-moving items with low turnover and non-moving items with the least to zero turnover.
4. What industries benefit from FSN analysis?
Industries that benefit the most from FSN analysis are those with high consumption and multiple product lines and SKUs. This helps them reduce waste and improve cash flow. For example, food and beverages, pharmaceuticals, and the automotive industry.